Building Our Future
A Revenue Plan for World-Class Schools in Maryland
![]()
Maryland policymakers have a once-in-a-generation opportunity in this legislative session to guarantee children across Maryland a world-class education. Strengthening our education system and investing in our children’s future is essential to building a thriving state and ensuring our economy fires on all cylinders. After a decade of eroding funding since the Great Recession, achieving the vision of the Commission on Innovation and Excellence in Education (Kirwan Commission) requires us to strengthen our commitment to Maryland’s public schools. The evidence is clear that investing in things like universal prekindergarten, expanded learning time, and one-on-one instruction for struggling learners will increase opportunity for children across the state and strengthen our economy in the long term. It is also clear that our schools cannot make these changes without additional resources.
Smart reforms to our state’s revenue system can close loopholes placed there by special interests and provide the additional funds our schools need. Our tax code today includes several ineffective components that hold Maryland back from being the best state we can be. As a result, revenue growth generally does not keep up with our needs, and our tax responsibilities get distributed upside-down—allowing the wealthiest to avoid making the same contributions the rest of us do.[i]If we clean up our tax code, we can afford to build a world-class public school system that will enable children across our state to thrive.
A Revenue System for Maryland’s Future
We can build a stronger, more equitable revenue system by taking three steps:
- Clean up our tax code. We should clean up Maryland’s revenue system by closing corporate tax loopholes, eliminating ineffective economic development subsidies, and reversing a recent cut to our millionaire estate tax. These special tax breaks benefit the powerful few but do nothing to help our economy.
- Modernize our sales tax. Maryland’s economy has changed a lot over the past several decades, but our tax code hasn’t kept up. We should modernize Maryland’s sales tax to reflect the increasing importance of services and online commerce to our economy. We can offset the impact on struggling Marylanders by expanding working family tax credits.
- Strengthen our income tax. Restructuring Maryland’s income tax will enable us to raise significant revenue, lower income taxes on most low- and middle-income Marylanders, and improve our upside-down tax code.
Together, these reforms will increase state revenues by $1.9 billion in fiscal year 2030 (adjusted for inflation)—enough to fully fund the state share of a robust public education reform package. Table 1 summarizes the plan for strengthening Maryland’s revenue system.
| TABLE 1. REVENUE REFORM COMPONENTS
|
|
| Clean up our tax code: | $560 million |
|
|
| Modernize our sales tax: | $460 million |
|
|
| Strengthen our income tax: | $920 million |
|
|
| Total: | $1.9 billion |
|
Note: Revenue estimates are for fiscal year 2030 and expressed in 2020 dollars. See technical appendix for details. |
|
Strengthened Investments Are the Key to Great Schools
Great public schools are part of the foundation of a thriving community. They reflect our understanding that every child has something to contribute and embody our commitment to providing the support children need to learn and thrive. Strong schools build the groundwork for our future prosperity by creating tomorrow’s skilled workforce and making Maryland an attractive place for families and businesses. While our state’s best schools demonstrate what is possible when we invest in learning, Maryland’s current education system does not grant all children the same opportunities.
A Story of Progress and Retreat
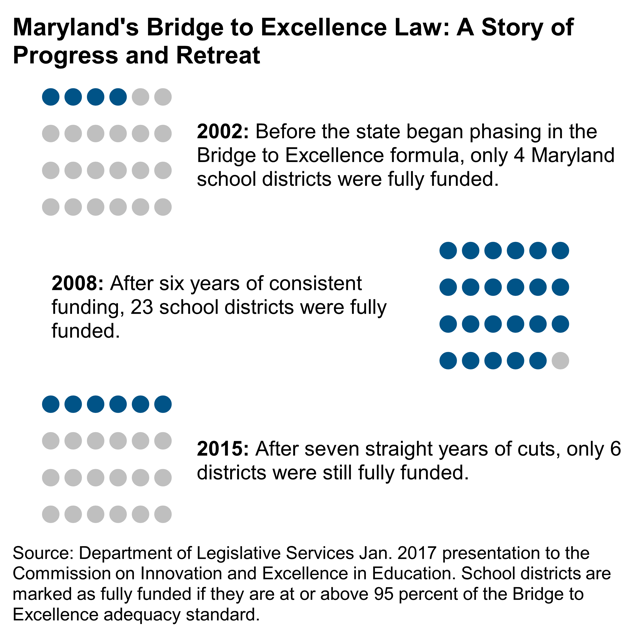 Maryland made significant progress in guaranteeing all children access to high-quality schools during the early years of the 21stcentury. Following passage of the Bridge to Excellence in Public Schools Act of 2002, the state ramped up education funding based on an analysis of the resources school districts needed to satisfy the state’s academic standards. During this ramp-up, the number of school districts at or close to this standard increased from four in 2002 to 23 in 2008—all but one of Maryland’s 24 county-based school districts.[ii]
Students’ test scores also improved during these years across multiple school districts, subjects, and grade levels. For example, the share of third graders scoring proficient or advanced on the Maryland School Assessment increased by 10 percentage points in math and 12 percentage points in reading from the 2003–2004 school year to 2007–2008.[iii]The gains were even larger in school districts where large numbers of students face barriers to learning because of low family income or the legacy of racial segregation.
As the Great Recession dragged house prices down and unemployment up, state and local revenues declined. Policymakers responded by suspending scheduled inflation adjustments in our school funding formula from 2009 to 2012 and capping the adjustments through 2015. During these years, improvements in student achievement stalled. For example, the share of third graders scoring proficient or advanced on the Maryland School Assessment in math increased by only 5 percentage points from 2007–2008 to 2011–2012, while the proficient and advanced share in reading increased by only 2 percentage points.[iv]
Although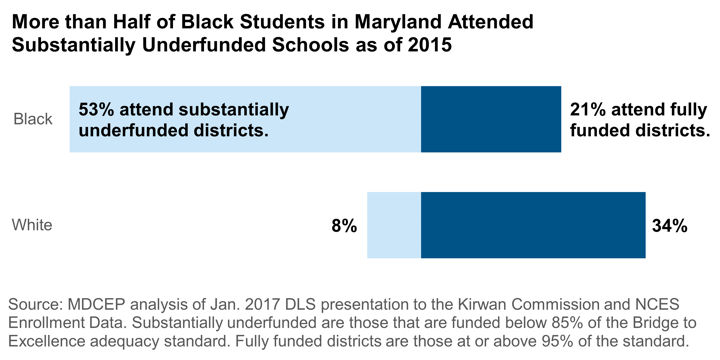 the state has since resumed making annual inflation adjustments, the cuts made between 2009 and 2015 continue to harm students. Because prices throughout the economy continued to rise during these years, it would have required an extra-large catch-up adjustment to make up the lost ground. The state instead simply returned to making routine annual adjustments, as if the earlier cuts had never happened. This decision made the cuts effectively permanent. Underfunding is now baked into our school funding formula, even in years when there are no additional cuts.
By 2015, the number of fully funded school districts had fallen to six, nearly back to the number in 2002.[v]Because Maryland schools are among the most racially segregated in the nation,[vi]these cuts hit students of color hardest. More than half of all Black students in Maryland attended a school district that was underfunded by 15 percent or more as of 2015.[vii]Eroding school funding also made a tangible impact in the classroom. Maryland public schools served 29,000 more students in the 2014–2015 school year than in 2007–2008, but they did so with fewer teachers to help these children learn.[viii]
As Maryland’s history of school funding shows, we have not invested enough in education in recent years to set our children up for success—but that hasn’t always been the case. We committed to providing all children a great education in the early years of this century, and for a few years we made that vision a reality. We can do it again.
The Verdict Is In: Investing in Education Works
Eroding school funding over the last decade has put Maryland children in a worse position to succeed in our modern economy and fully participate in their communities. Continuing down this path would ultimately undermine the foundation of our state’s prosperity. On the other hand, we know that we can build a strong public education system if we are willing to make the needed investments. A large body of careful research makes clear that sufficient funding is essential to providing all children a high-quality public education.
A highly regarded study published in 2016 examined the effects of court-ordered education finance reforms on students’ success in school.[ix]More than half of states have enacted such reforms after courts concluded they had fallen short of their constitutional obligations to educate children. The researchers found that when school funding increased in response to a court order, students went on to complete more years of education, earn more in adulthood, and experience lower poverty rates. The improvements were strongest among students in low-income families. Several other studies of court-ordered school finance reforms have drawn similar conclusions using a variety of analytical methods.[x]Together, the results of multiple studies using credible research designs, different data sources, and different outcome measures provide compelling evidence that increased education funding makes a difference.
Researchers have also learned a great deal about what specific in-school practices can help students succeed.[xi]Many of these strategies are supported by randomized controlled trials—often referred to as the “gold standard” of evidence in social science. Research-backed approaches include prekindergarten, smaller class sizes, improved teacher pay, and expanded learning time. Children who face additional obstacles particularly benefit from services like physical and behavioral health care provided at the school site to ensure they are healthy and ready to learn. Each of these strategies can yield significant gains for students and the economy—and each one requires sufficient resources to succeed.
Conversely, a strategy of hoping for better results while continuing to fund Maryland schools at the current, inadequate level is all but guaranteed to fail. This is the key insight confirmed by research in the field of education cost analysis: In education as in every other part of life, better results cost more.[xii]When states raise their expectations of students, as Maryland has in recent years, more resources such as additional teachers or better teacher pay are needed to make those expectations achievable. The implications for Maryland are clear: if we are serious about guaranteeing a world-class education to children in every part of our state, we have to commit to investing more in our public schools.
A Rare Opportunity
Maryland policymakers now have a rare opportunity make this vision a reality. The Commission on Innovation and Excellence in Education (the Kirwan Commission) has been working since 2016 to develop recommendations for improving the state’s education policies. The commission is now putting the finishing touches on its proposals and preparing recommendations for the governor and legislature. If the process generates effective reforms, it will yield major benefits for Maryland children and our state’s economy for many years to come.
A Revenue System for Maryland’s Future
Putting Maryland schools back on track will require us to make new investments, and policymakers will have to decide how to raise the necessary resources. The best choice is to increase revenue by reforming our state’s tax code. If we address weaknesses in our current revenue system, we can build a tax code that is more effective and more equitable.[xiii]
Maryland’s tax code today has three major shortcomings that hold us back from being the best state we can be:
- Special interests get tax breaks that don’t help our economy. A small number of powerful actors like large, multistate corporations and ultra-wealthy heirs have used their outsized influence to promote policies that reduce their own tax responsibilities. These special tax breaks cost the rest of us millions and do nothing to strengthen Maryland’s economy.
- Outdated policies have chipped away at our sales tax. Maryland’s economy has changed a lot over the past several decades, but our tax code hasn’t kept up. Services increased from less than one-third of household consumption nationwide in 1970 to nearly half as of 2011.[xiv]But we still exempt most services from the state sales tax, a relic from 20thcentury tax policy. As a result, sales tax revenue has grown more slowly than Maryland’s overall economy.[xv]
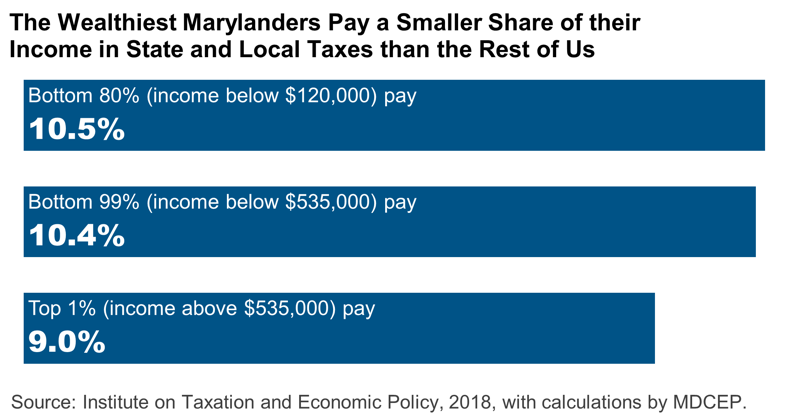
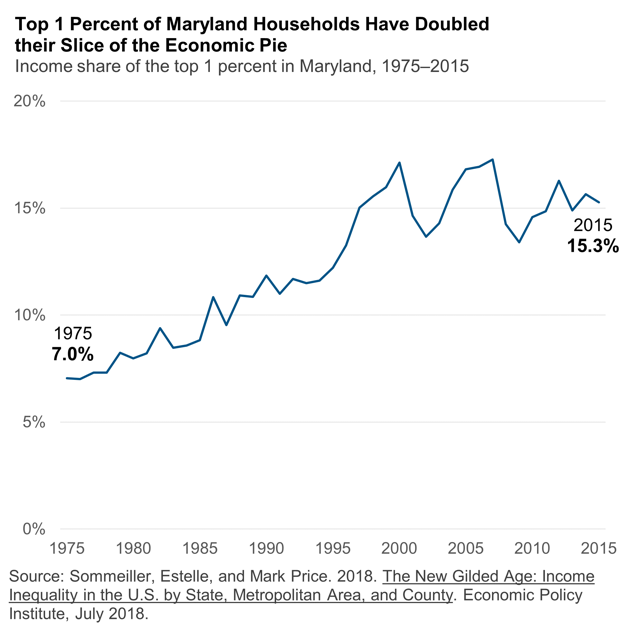
- Our tax responsibilities are upside-down. The wealthiest 1 percent of Maryland households pay a smaller share of their income in state and local taxes than the rest of us do, despite doubling their slice of the economic pie over the last 40 years.[xvi]This means that our tax code further concentrates wealth and power in a few hands and does nothing to reduce the economic barriers that hold back many Marylanders, especially people of color.
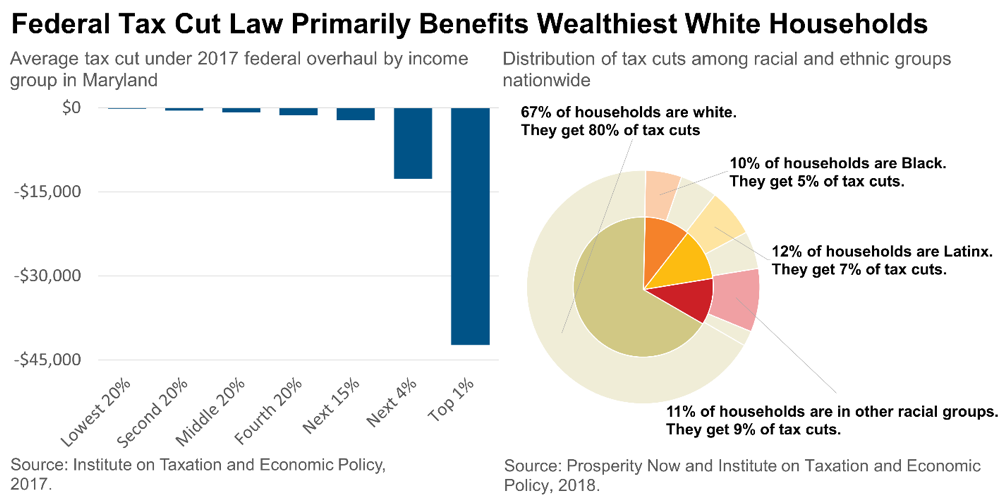
Recent changes in federal tax policy have made our overall tax system—federal, state, and local—even more lopsided. The hastily drafted 2017 federal tax overhaul gave away trillions to wealthy households and large corporations, undermined the federal government’s fiscal position,[xvii]and heightened obstacles to opportunity for people of color nationwide.[xviii]
We can raise the resources needed to invest in the pillars of our economy if we take three steps to move Maryland’s revenue system onto a better path.
Step 1: Clean Up Our Tax Code
We should clean up Maryland’s revenue system by getting rid of special tax breaks that benefit the powerful few but do nothing to help our economy:
- Close corporate tax loopholes. We should adopt a strong combined reporting requirement to prevent large corporations from artificially stashing profits in low-tax states or overseas tax havens. About half of states that levy corporate income taxes use combined reporting, and a growing number are including overseas tax havens in this system.[xix]We should also adopt the throwback rule, a reform that eliminates corporate “nowhere income” that is not taxable in any state.
- Close the pass-through loophole. Today, businesses that organize as S-corporations, LLCs, or other so-called pass-through entities can avoid paying corporate income tax, no matter how large or profitable they become.[xx]We should partially offset that special treatment by levying a 4 percent tax—just under half the corporate tax rate—on the largest pass-through businesses. This reform would continue to protect small businesses by allowing all companies to deduct their first $1 million in profits and exempting sole proprietorships.
-
HOW DOES THE CASINO LOCKBOX FIT IN? Voters last November approved an amendment to the state constitution requiring gambling revenues to add to public school funding rather than replacing existing funding. This amendment (informally called the “lockbox”) will fulfill the promise policymakers made when the state expanded gambling in 2007 and 2012. At the same time, it is only one part of the solution to guaranteeing all children in Maryland a great public education and investing in other pillars of our economy like health care and transportation.
- The state budget for the current year anticipates $532 million in casino revenue earmarked for schools. Casino revenues have averaged a little under $500 million annually over the last five years. While putting this revenue on top of existing school funding is a significant step forward, a greater investment is needed to guarantee all children a world-class education.
- Hogan has proposed to put the lockbox funding toward school construction rather than operating costs. More investments in school construction are sorely needed to ensure all children can go to school in an up-to-date building with safe temperatures all year round. In the 2016–2017 school year, nearly one-third of Maryland students attended a school district in which the average school building was over 35 years old.
- In practice, the lockbox requires the state to shift money from other parts of the budget into education. Cleaning up our tax code will allow us to make the needed investments in public schools while protecting other essential services like health care and transportation.
Eliminate ineffective economic development subsidies. Maryland currently spends millions on special tax breaks for businesses in hopes of spurring economic development, despite growing evidence that these subsidies do not work. We should eliminate five subsidy programs that state analysts have found to be deeply flawed: the Enterprise Zone Tax Credit, the Film Production Activity Tax Credit, the Biotechnology Investment Incentive Tax Credit, the Businesses that Create New Jobs Tax Credit, and the One Maryland Economic Development Tax Credit.[xxi]We should also allow several other subsidy programs to expire as scheduled.
- Restore the millionaire estate tax. The General Assembly in 2014 increased the estate tax exemption from $1 million to over $5 million, handing a windfall to a small number of ultra-wealthy heirs and making it harder for the state to invest in essential services. This change was misguided to begin with and, because of changes made by the 2017 federal tax overhaul, even its stated goal of matching the Maryland estate tax to the federal exemption no longer applies. We should reverse the flawed choice we made in 2014 and restore the exemption to $1 million.
By fiscal year 2030, the year the Kirwan Commission’s school funding package fully phases in, these reforms would increase state revenues by about $560 million, adjusted for inflation.[xxii]
Step 2: Modernize Our Sales Tax
We should modernize Maryland’s sales tax to reflect the increasing importance of services and online commerce to our economy:[xxiii]
- Apply consistent standards to tangible goods, digital goods, and services.We should expand the sales tax base to include digital goods like apps and ebooks, as well as the majority of services. This will reverse the erosion of sales tax revenue that has occurred over the last several decades as people have changed their buying habits and prevent future erosion.
- Maintain prudent exemptions.While policymakers should steer clear of arbitrary exemptions designed to benefit special interests, two kinds of services should not be subject to taxation. First, we should exempt necessary services like health care and tuition—just as we currently exempt necessary goods like groceries and some personal hygiene products.[xxiv]Second, policymakers should exempt services that are purchased exclusively by businesses, such as payroll processing and commercial real estate management. This exemption would prevent so-called “pyramiding” in which businesses pass these taxes through to customers in the form of higher prices.
- Offset impacts on struggling families.Modernizing the sales tax is the right choice because it will make our revenue system more effective and enable us to invest in strong schools and other essential services. At the same time, families with low incomes pay an outsized share of their income in sales taxes because they are more likely to live paycheck to paycheck. We should offset the impact of a broader sales tax base by expanding tax credits for working families like the Earned Income Tax Credit.
Together, modernizing the sales tax and expanding working family tax credits would increase fiscal year 2030 revenues by about $460 million.
Step 3: Strengthen Our Income Tax
We should improve our upside-down tax code by building a stronger, more equitable income tax. The brackets and tax rates shown in Table 2 would raise significant revenue while reducing income taxes for the majority of low- and moderate-income Marylanders.
| TABLE 2. REFORMED INCOME TAX STRUCTURE | ||||
| SINGLE OR MARRIED FILING SEPARATELY | MARRIED OR HEAD OF HOUSEHOLD | MARGINAL TAX RATE | ||
| TAXABLE INCOME | BASE TAX | TAXABLE INCOME | BASE TAX | |
| $0 to $3,000 | $0.00 | $0 to $4,500 | $0.00 | 3.0% |
| $3,000 to $6,000 | $90.00 | $4,500 to $9,000 | $135.00 | 3.5% |
| $6,000 to $12,000 | $195.00 | $9,000 to $18,000 | $292.50 | 4.0% |
| $12,000 to $24,000 | $435.00 | $18,000 to $36,000 | $652.50 | 4.5% |
| $24,000 to $48,000 | $975.00 | $36,000 to $72,000 | $1,462.50 | 5.0% |
| $48,000 to $96,000 | $2,175.00 | $72,000 to $144,000 | $3,262.50 | 5.5% |
| $96,000 to $192,000 | $4,815.00 | $144,000 to $288,000 | $7,222.50 | 6.0% |
| $192,000 to $1 million | $10,575.00 | $288,000 to $1 million | $15,862.50 | 6.5% |
| Over $1 million | $63,095.00 | Over $1 million | $62,142.50 | 7.0% |
| Note: “Base tax” refers to the tax responsibility of a household at the bottom of a given income bracket. For example, a single filer with $48,000 taxable income will pay $2,175 in state income tax. A filer’s tax responsibility is equal to Base Tax + Marginal Tax Rate × (Taxable Income – Bracket Lower Bound). For example, a single filer with $50,000 taxable income would pay $2,175 + 5.5% × ($50,000 – $48,000) = $2,285. Under the current structure, this filer would pay $2,322.50. | ||||
The state should take two additional steps to strengthen our income tax:
- Decouple from flawed federal legislation. The 2017 federal tax overhaul eliminates a rule known as the Pease Disallowance, which phases out itemized deductions for the highest-income tax filers. Eliminating this rule is in line with the law’s overall approach of handing massive tax breaks to a small number of powerful beneficiaries—and it automatically translates into an additional cut in state taxes for the same households. We should reinstate the Pease Disallowance for Maryland taxes.[xxv]
- Offset special treatment of capital gains. The federal tax code gives special treatment to income from capital gains—the net gain from the sale of an asset that has increased in value. The top federal tax rate on capital gains income is 23.8 percent, far below the 40.8 percent top rate on income from work. Because capital gains go only to households with accumulated wealth, they are even more lopsided than income from other sources. Nationwide, the wealthiest 1 percent of tax filers get two-thirds of all capital gains income, compared to one-sixth of income from all sources.[xxvi]The special treatment of capital gains is also an important driver of racial and ethnic inequity, because the wealthiest 10 percent of white households control nearly two-thirds of all wealth nationwide.[xxvii]The state should partially offset this special treatment with a 1 percent surtax on capital gains income.
Together, these reforms would increase fiscal year 2030 revenue by $920 million.
Combined Impact: A Stronger, More Equitable Tax Code
| TABLE 3. REVENUE REFORM COMPONENTS | |
| Clean up our tax code: | $560 million |
|
|
| Modernize our sales tax: | $460 million |
|
|
| Strengthen our income tax: | $920 million |
|
|
| Total: | $1.9 billion |
| Note: Revenue estimates are for fiscal year 2030 and expressed in 2020 dollars. See technical appendix for details. | |
Table 3 summarizes the combined impact of steps 1 through 3. Together, these reforms would increase state revenues in fiscal year 2030 by $1.9 billion. If the state continues to provide half of all non-federal funding for Maryland public schools, this revenue will fully cover the state share of the education reform plan the Kirwan Commission is considering. Details on the revenue estimation methodology are available in the technical appendix.
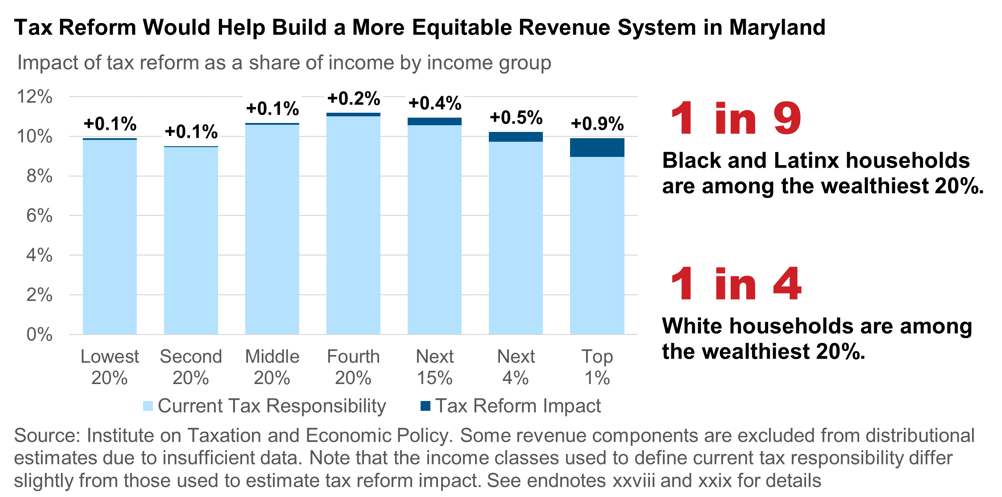
The reforms outlined in this section would go a long way toward fixing Maryland’s current upside-down tax code. The wealthiest 5 percent of Marylanders—who currently pay a smaller share of their income in state and local taxes than the rest of us do—would be responsible for 58 percent of the increase in revenue from these reforms.[xxviii]Meanwhile, the 60 percent of Marylanders with household income under $79,000 would be responsible for 5 percent of the revenue increase.[xxix]
Fixing our upside-down tax code would help reduce barriers facing Marylanders of color who today are too often locked out of economic opportunity. About half of Black and Latinx Marylanders have household income under $44,000, placing them among the lowest 40 percent of households by income. Meanwhile, only one in nine have household incomes above $120,000, high enough to place them among the wealthiest 20 percent. Furthermore, several of the reforms outlined above would improve racial and ethnic equity by eliminating or offsetting special tax breaks that benefit only households that have significant accumulated wealth. Because a long history of discriminatory policies has concentrated the majority of the nation’s wealth among a small number of white households, reforms like combined reporting, closing the pass-through loophole, and offsetting special treatment of capital gains are key to building a more equitable tax code.
Strengthening Our Tax Code Is the Right Choice for Maryland’s Economy
If we strengthen Maryland’s revenue system by closing loopholes and fixing our upside down tax code, we can afford to invest in the pillars of our economy. Other states that have taken this step have enjoyed strong job and wage growth while investing more in the foundations of long-term prosperity.
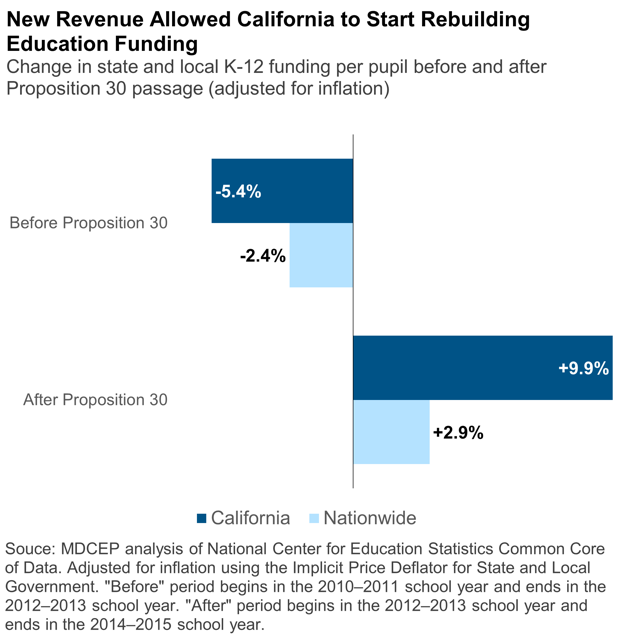 California’s Proposition 30 is a recent example.[xxx]Like Maryland, California responded to revenue shortfalls in the aftermath of the Great Recession with deep cuts to public school funding. By the budget year that began in July 2012, state and local investments in California schools were 15 percent below the national average.[xxxi]For five years straight, schools weren’t able to hire enough teachers to keep up with enrollment growth, leading to larger classes and less individual attention for students.[xxxii]
The state started on a different path in 2012. That year, voters approved a ballot measure to raise revenue with higher income tax rates on the state’s wealthiest families and a small increase in the sales tax.
The revenue from this measure allowed the state to rebuild its investments in public schools. State and local school funding in California increased by 10 percent per pupil from 2013 to 2015, adjusted for inflation—more than three times the national average.[xxxiii]With this added funding, schools were able to hire more teachers and start bringing back down the number of students per teacher.[xxxiv]
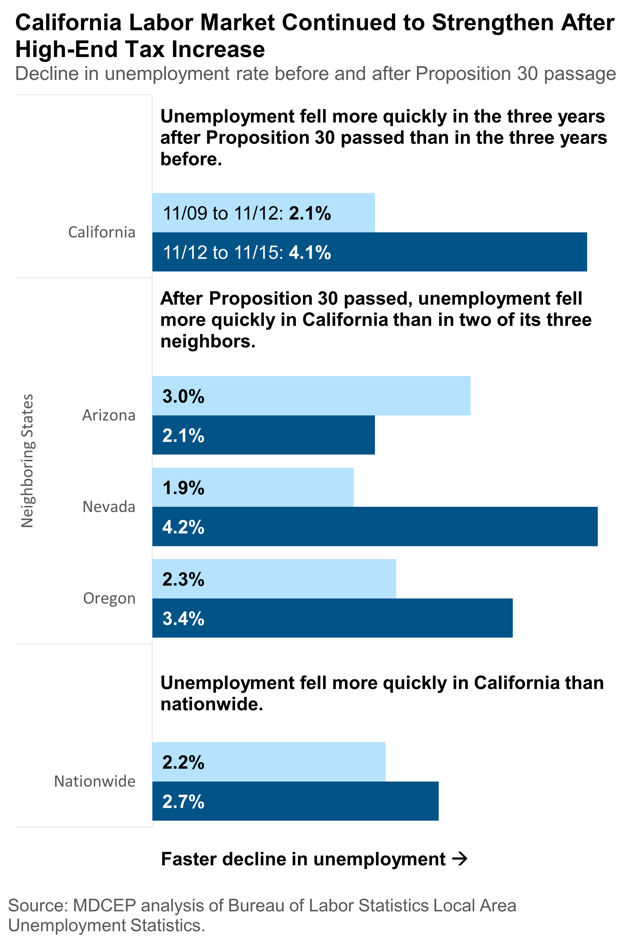
Meanwhile, California’s economy thrived. In the three years following passage of Proposition 30, the unemployment rate fell faster in California than in two of the state’s three neighbors and faster than the national unemployment rate.[xxxv]This strong performance mirrors the findings of a sophisticated apples-to-apples analysis by researchers at the UC Berkeley Labor Center.[xxxvi]From 2011 to 2016—a period that includes Proposition 30 as well as several new legal protections for California workers and the environment—California outperformed a group of comparable states in job growth, wage growth, and total economic output. The state’s residents signaled their satisfaction with these results in 2016, with more than 60 percent voting to extend high-end income tax rates that were scheduled to expire.[xxxvii]
What California’s experience makes clear is that it is possible to simultaneously build an equitable revenue system, invest in public schools, and enjoy strong economic performance. Multiple factors influenced California’s economy during this period, so it is prudent to withhold judgment on the degree to which Proposition 30 is directly responsible for the state’s success. The full benefits of investing in education will only be realized over the long term as today’s students enter the workforce.
California’s experience is consistent with credible academic research on the impacts of tax policy on state economies. Here’s what that research shows:
- Other factors matter more when families move.High-quality research shows that families consider jobs, housing costs, weather, and where their relatives live when they decide where to locate. Taxes generally don’t make the list or appear near the bottom.[xxxviii]Those with the highest incomes move across state lines less frequently than other families, and tax rates don’t have an economically significant impact on where they choose to live.[xxxix]
- Other factors matter more for job growth.Most job creation comes from young, homegrown companies expanding—and most entrepreneurs launch a business in the state where they already live.[xl]Even when companies do move, other factors like skilled workers and reliable transportation matter more than taxes.[xli]That’s partly because state and local taxes add up to only 2 to 3 percent of most companies’ business costs.[xlii]
 The fact is, Maryland has a lot to offer as a place to live, work, and do business. We have the highest median household income among the 50 states.[xliii]Our workforce is highly educated, with the second-highest share of advanced degree holders.[xliv]College graduates have moved into Maryland at higher rates in recent years than into most other states.[xlv]We have the nation’s highest share of millionaires per capita.[xlvi]And our mix of taxes and services is among the most favorable to businesses, according to the accounting and consulting firm Ernst and Young.[xlvii]
We face a choice: Do we clean up our tax code to invest in world class schools, or do we go down a path that leaves our schools falling further behind and our economy worse off? Without additional revenues, the only way to adequately fund schools would be to drastically cut other services Marylanders rely on, like health care and transportation.
Voluminous evidence tells us that leaving our schools in their current state is likely to damage our economy in the long run. Our children will grow up with fewer skills, making it harder for them to succeed on the job market, and businesses will have a harder time finding the workforce they need.
Cutting from other areas of the budget to invest more in schools is no more promising. After a decade of gradual cuts since the Great Recession, Marylanders’ unmet needs are beginning to pile up across a wide range of areas. Our population is aging, increasing the need for long-term care that is largely paid for through Medicaid. The transit systems that keep our state’s metropolitan anchors humming have a growing list of maintenance needs. Nonpartisan legislative analysts recently estimated that state agencies are understaffed to the tune of nearly 2,500 workers.[xlviii]Cutting budgets further would only make these problems worse and ultimately threaten Maryland’s future prosperity.
There is a better way. States that have closed special interest loopholes and improved their upside down tax codes have been able to strengthen their schools while enjoying strong economic performance. Maryland’s own investment in public schools in the early years of this century is proof that we are capable of big things. We should recommit to the smart choices we made in the past by cleaning up our tax code and using the gains to invest in Maryland’s future.
For details on assumptions and methodology, please refer to the technical appendix.
Endnotes
[i]Meg Wiehe, Aidan Davis, Carl Davis, Matt Gardner, Lisa Christensen Gee, and Dylan Grundman, “Who Pays? A Distributional Analysis of the Tax Systems in All 50 States,” Institute on Taxation and Economic Policy, 2018, https://itep.org/wp-content/uploads/whopays-ITEP-2018.pdf
[ii]“Adequacy of Education Funding in Maryland,” Department of Legislative Services presentation to the Commission on Innovation and Excellence in Education, January 9, 2017, http://dls.maryland.gov/pubs/prod/NoPblTabMtg/CmsnInnovEduc/2017_01_09_DLS_Presentation_Adequacy.pdf
[iii]MDCEP analysis of Maryland Report Card student achievement data (http://reportcard.msde.maryland.gov/). This type of observational relationship should be treated with caution, because multiple factors simultaneously affect student achievement. However, this pattern is in line with high-quality research showing a causal relationship between increased school resources and improved student achievement. See for example C. Kirabo Jackson, Rocker Johnson, and Claudia Persico, “The Effects of School Spending on Educational and Economic Outcomes: Evidence from School Finance Reforms,” The Quarterly Journal of Economics 131 no. 1, 2016, https://www.nber.org/papers/w20847.pdf
[iv]MDCEP analysis of Maryland Report Card student achievement data. The flattening of achievement gains generally did not begin immediately in 2008 but rather occurred on a lag. This is consistent with the benefits of school resources accumulating over multiple years. Once again, it is not possible in observational data to isolate the effect of funding cuts from other factors that may have affected student achievement. Changes in curriculum and assessment confound comparisons beyond 2012.
[v]“Adequacy of Education Funding in Maryland,” 2017.
[vi]Gary Orfield and Erica Frankenberg, “Brown at 60: Great Progress, a Long Retreat and an Uncertain Future,”
The Civil Rights Project, last modified May 15, 2014, https://civilrightsproject.ucla.edu/research/k-12-education/integration-and-diversity/brown-at-60-great-progress-a-long-retreat-and-an-uncertain-future/Brown-at-60-051814.pdf.
[vii]MDCEP analysis of data from DLS analysis of funding adequacy and National Center for Education Statistics enrollment data by race for the 2014–2015 school year.
[viii]MDCEP analysis of National Center for Education Statistics Common Core of Data (https://nces.ed.gov/ccd/pubagency.asp).
[ix]Jackson, Johnson, and Persico, 2016.
[x]For detailed discussion of the literature on court-ordered school finance reforms, see Christopher Meyer, “Investing in Every Child: The Future of Compensatory Education Aid in Maryland,” Maryland Center on Economic Policy, 2017, http://www.mdeconomy.org/wp-content/uploads/2017/09/MDCEP_InvestEveryChild_2017_FNLlo.pdf
[xi]Allan Odden and Lawrence Picus, “Appendix F: Full Report and School Case Studies for the Evidence-Based Approach to Estimating a Base Spending Level and Pupil Weights for Maryland,” Augenblick, Palaich, and Associates, 2016, http://www.marylandpublicschools.org/Documents/adequacystudy/AppendixFSchoolCaseStudies113016.pdf
See also discussion in Meyer, 2017.
[xii]Bruce Baker, “Does Money Matter in Education?” Albert Shanker Institute, 2016, https://docs.google.com/viewerng/viewer?url=http://www.shankerinstitute.org/sites/shanker/files/moneymatters_edition2.pdf
[xiii]For more discussion of Maryland tax policy, see “Blueprint for Broadly Shared Prosperity in Maryland: Creating a Fairer Tax Code and Responsible Budget Practices,” Maryland Center on Economic Policy, 2018, http://www.mdeconomy.org/creating-a-fairer-tax-code-and-responsible-budget-practices/
[xiv]Michael Leachman and Michael Mazerov, “Four Steps to Moving State Sales Taxes into the 21st Century,” Center on Budget and Policy Priorities, 2013, https://www.cbpp.org/research/state-budget-and-tax/four-steps-to-moving-state-sales-taxes-into-the-21st-century
[xv]The effective sales tax base (revenues divided by the statutory tax rate) declined from 29 percent of Maryland personal income in 1980 to 21 percent in 2017 (MDCEP analysis of revenue data from the Maryland Department of Legislative Services and Department of Management and Budget and personal income data from the U.S. Bureau of Economic Analysis).
[xvi]Estelle Sommeiller and Mark Price, “The New Gilded Age: Income Inequality in the U.S. by State, Metropolitan Area, and County,” Economic Policy Institute, 2018, https://www.epi.org/publication/the-new-gilded-age-income-inequality-in-the-u-s-by-state-metropolitan-area-and-county/
[xvii]While the federal budget deficit does not pose an urgent threat to the U.S. economy, policymakers like Senate Majority Leader Mitch McConnell have used the deficits created by the 2017 tax overhaul as justification to call for cuts to Social Security, Medicare, and Medicaid.
[xviii]Meg Wiehe, Emanuel Nieves, Jeremie Greer, and David Newville, “Race, Wealth, and Taxes: How the Tax Cuts and Jobs Act Supercharges the Racial Wealth Divide,” Prosperity Now and Institute on Taxation and Economic Policy, 2018, https://prosperitynow.org/sites/default/files/resources/ITEP-Prosperity_Now-Race_Wealth_and_Taxes-FULL%20REPORT-FINAL_5.pdf
[xix]Michael Mazerov, “New Jersey Can Strike Blow Against Tax Havens,” Center on Budget and Policy Priorities, 2016, https://www.cbpp.org/blog/new-jersey-can-strike-blow-against-tax-havens
[xx]Michael Leachman and Michael Mazerov, “How Should States Respond to Recent Federal Tax Changes?” Center on Budget and Policy Priorities, 2018, https://www.cbpp.org/research/state-budget-and-tax/how-should-states-respond-to-recent-federal-tax-changes
Pass-through companies pay a small annual filing fee, as well as other taxes such as sales and property taxes. Like corporate shareholders, owners of pass-through companies pay personal income taxes on income they receive from these businesses. However, the unwarranted special tax break large pass-through companies receive on their profits has driven a growing share of businesses to organize as pass-throughs, eroding the corporate tax base. “Taxing Businesses through the Individual Income Tax,” Congressional Budget Office, 2012, https://www.cbo.gov/sites/default/files/112th-congress-2011-2012/reports/43750-TaxingBusinesses2.pdf
[xxi]See the following Department of Legislative Services analyses for detailed discussion:
Robert Rehrmann, Matthew Bennett, Benjamin Blank, Mya Coover, Mindy McConville, Heather Ruby, and Michael Sanelli, “Evaluation of the Enterprise Zone Tax Credit,” Department of Legislative Services, 2014, http://dls.maryland.gov/pubs/prod/TaxFiscalPlan/WEB-Evaluation-of-the-Enterprise-Zone-Tax-Credit.pdf
Robert Rehrmann, Matthew Bennett, Benjamin Blank, George Butler, Mya Dempsey, Mindy McConville, Maureen Merzlak, and Heather Ruby, “Evaluation of the Maryland Film Production Activity Tax Credit,” Department of Legislative Services, 2015, http://dls.maryland.gov/pubs/prod/TaxFiscalPlan/Evaluation-of-the-Maryland-Film-Production-Activity-Tax-Credit.pdf
Robert Rehrmann, George Butler, Katylee Cannon, Annette Haldeman, Kamar Merritt, Maureen Merzlak, Heather Ruby, Nancy Scaggs, and Charity Scott, “Evaluation of the Biotechnology Investment Incentive Tax Credit, Department of Legislative Services, 2018, http://dls.maryland.gov/pubs/prod/TaxFiscalPlan/Evaluation-of-the-Biotechnology-Investment-Incentive-Tax-Credit-Report.pdf
Warren Deschenaux, “Draft Evaluation of the Businesses that Create New Jobs Tax Credit,” Department of Legislative Services, 2016, http://dls.maryland.gov/pubs/prod/TaxFiscalPlan/Evaluation-of-the-Businesses-that-Create-New-Job-Tax-Credit.pdf
Robert Rehrmann, Benjamin Blank, Mya Coover, Mindy McConville, and Heather Ruby, “Evaluation of the One Maryland Economic Development Tax Credit,” Department of Legislative Services, 2014, http://dls.maryland.gov/pubs/prod/TaxFiscalPlan/WEB-Final-One-MD-Report.pdf
[xxii]All revenue estimates are expressed in 2020 dollars to match cost estimates for the Kirwan Commission. See technical appendix for revenue estimation methodology.
[xxiii]For more discussion of sales tax policy, see “Creating a Sales Tax that Reflects our Modern Economy,” Maryland Center on Economic Policy, 2018, http://www.mdeconomy.org/creating-a-sales-tax-that-reflects-our-modern-economy/
[xxiv]We should also consider expanding this exemption to include other necessary goods such as diapers. This exemption is not included in revenue estimates.
[xxv]This provision is scheduled to expire at the end of 2025 along with other provisions of the 2017 law relating to personal income taxes. For this reason, reinstatement of the Pease Disallowance is not included in FY 2030 revenue estimates in this report. Reinstatement would increase state revenues until 2025, and would protect about $100 million in FY 2030 revenues if Congress extends the personal income tax provisions of the 2017 overhaul.
[xxvi]Elizabeth McNichol, “State Taxes on Capital Gains,” Center on Budget and Policy Priorities, 2018, https://www.cbpp.org/research/state-budget-and-tax/state-taxes-on-capital-gains
[xxvii]Michael Leachman, Michael Mitchell, Nicholas Johnson, and Erica Williams, “Advancing Racial Equity with State Tax Policy,” Center on Budget and Policy Priorities, 2018, https://www.cbpp.org/research/state-budget-and-tax/advancing-racial-equity-with-state-tax-policy
[xxviii]Estimated distributional impacts include domestic combined reporting, restoration of the millionaire estate tax, expansion of the sales tax base, and restructuring of the personal income tax. These reforms are together expected to generate about $1.5 billion in FY 2030, or three-quarters of the total revenue increase. Because of insufficient data, these estimates do not include the incorporation of offshore tax havens into combined reporting, adopting the throwback rule, closing the passthrough loophole, eliminating ineffective economic development subsidies, expanding working family tax credits, or the capital gains surtax. Nearly all of these reforms are expected to primarily affect wealthy households. Reinstating the Pease Disallowance is expected to affect only the wealthiest 20 percent of households, but is not included in any revenue estimates in this report.
[xxix]Boundaries between income classes are estimated based on the Institute on Taxation and Economic Policy Microsimulation Tax Model. Note that the boundaries in this section differ from those in “Who Pays?” Wiehe et al., 2018, because of differences in the analysis period and universe.
[xxx]For more discussion of Proposition 30, see William Chen, “What Has Proposition 30 Meant for California?” California Budget and Policy Center, 2016, https://calbudgetcenter.org/wp-content/uploads/Issue-Brief-What-Has-Prop.-30-Meant-09.2016.pdf
[xxxi]MDCEP analysis of National Center for Education Statistics financial data.
[xxxii]Chen, 2016.
[xxxiii]MDCEP analysis of National Center for Education Statistics financial data.
[xxxiv]Chen, 2016.
[xxxv]MDCEP analysis of Bureau of Labor Statistics Local Area Unemployment Statistics and Current Population Survey Statistics.
[xxxvi]Ian Perry, “California Is Working: The Effects of California’s Public Policy on Jobs and the Economy Since 2011,” UC Berkeley Center for Labor Research and Education, 2017, http://laborcenter.berkeley.edu/pdf/2017/California-is-Working.pdf
[xxxvii]Liam Dillon, “Voters Approve Proposition 55, Which Extends Higher Income Tax Rates for the Wealthiest Californians,” Los Angeles Times, Nov. 8, 2016, http://www.latimes.com/nation/politics/trailguide/la-na-election-day-2016-proposition-55-income-tax-1478277671-htmlstory.html
[xxxviii]Michael Mazerov, “State Taxes Have a Negligible Impact on Americans’ Interstate Moves,” Center on Budget and Policy Priorities, 2014, https://www.cbpp.org/research/state-budget-and-tax/state-taxes-have-a-negligible-impact-on-americans-interstate-moves
[xxxix]Cristobal Young, Charles Varner, Ithai Lurie, and Richard Prisinzano, “Millionaire Migration and Taxation of the Elite: Evidence from Administrative Data,” American Sociological Review 81(3), 2016, https://web.stanford.edu/~cy10/public/Jun16ASRFeature.pdf
[xl]Michael Mazerov and Michael Leachman, “State Job Creation Strategies Often Off Base,” Center on Budget and Policy Priorities, 2016, https://www.cbpp.org/research/state-budget-and-tax/state-job-creation-strategies-often-off-base
[xli]Geraldine Gambale, “32ndAnnual Corporate Survey & the 14thAnnual Consultants Survey,” Area Development, 2018, http://www.areadevelopment.com/Corporate-Consultants-Survey-Results/Q1-2018/32nd-annual-corporate-survey-14th-annual-consultants-survey.shtml
[xlii]Robert Tannenwald, “Testimony of Robert Tannenwald, Senior Fellow, before the New Hampshire Business Tax Commission,” Center on Budget and Policy Priorities, 2010, https://www.cbpp.org/testimony-of-robert-tannenwald-senior-fellow-before-the-new-hampshire-business-tax-commission
[xliii]2017 American Community Survey one-year estimates.
[xliv]Ibid.
[xlv]Quoctrung Bui, “The States That College Graduates Are Most Likely to Leave,” The New York Times, Nov. 22, 2016, https://www.nytimes.com/2016/11/22/upshot/the-states-that-college-graduates-are-most-likely-to-leave.html
[xlvi]Robert Frank, “States with the Most Millionaires Per Capita,” CNBC, Feb. 7, 2018, https://www.cnbc.com/2018/02/07/states-with-the-most-millionaires-per-capita.html
[xlvii]“Total State and Local Business Taxes: State-by-State Estimates for Fiscal Year 2016,” Ernst & Young LLP, 2017, https://www.ey.com/Publication/vwLUAssets/ey-total-state-and-local-business-taxes-2016/$File/ey-total-state-and-local-business-taxes-2016.pdf
[xlviii]“Spending Affordability Briefing,” Department of Legislative Services, 2017, http://mgaleg.maryland.gov/Pubs/BudgetFiscal/2017-spending-affordability-briefing-november-14.pdf#page=21