Budgeting for Opportunity: Maryland’s Workforce Development Policy Can be a Tool to Remove Barriers and Expand Opportunity
Contents
- Introduction and Summary
- Workforce Development and its Context
- Inequity in Maryland’s Labor Market: High-Level Trends
- Uneven Opportunity in Maryland’s Labor Market: Drilling Down
- Workers Face Stacked Barriers
- Maryland’s Workforce Development Budget
- Evaluating the Performance of Maryland’s Workforce Development System
- Maryland Agencies Do too Little to Protect Workers
- Recommendations
Every Marylander should have access to a decent job that pays enough to support a family – regardless of their race, ethnicity, gender, or any other aspect of their identity. However, the labor market we have today is far from this ideal. Too many jobs offer paltry wages or lack basic protections, and structural barriers disproportionately keep women, workers of color, and workers with disabilities out of good jobs.
The shared investments we make as a state have the power to move our labor market toward justice and inclusion, or away from it. Nearly every investment the state makes plays a role in supporting a healthy labor market, from public schools to public health and more. Our workforce development system is one investment that focuses specifically on strengthening our labor market, and making wise choices about our investments in workforce development – choices about how much to invest as well as choices about how to run these services – can make our economy more equitable.
There are a number of different ways to define workforce development. This report focuses on three main purposes:
- Fostering a skilled workforce
- Removing barriers to employment
- Supporting economic development
Barriers and Inequity Shape Maryland’s Labor Market
Our economy and Marylanders’ lives are shaped by a history of policy choices that promote and foster unequal access to opportunity. Harmful policy choices made over multiple centuries and continuing to the present day have built injustice into our labor market. Most workers have seen their wages fall behind the pace of economic growth over the last several decades, and workers of color typically face higher unemployment rates and lower wages than their white counterparts:
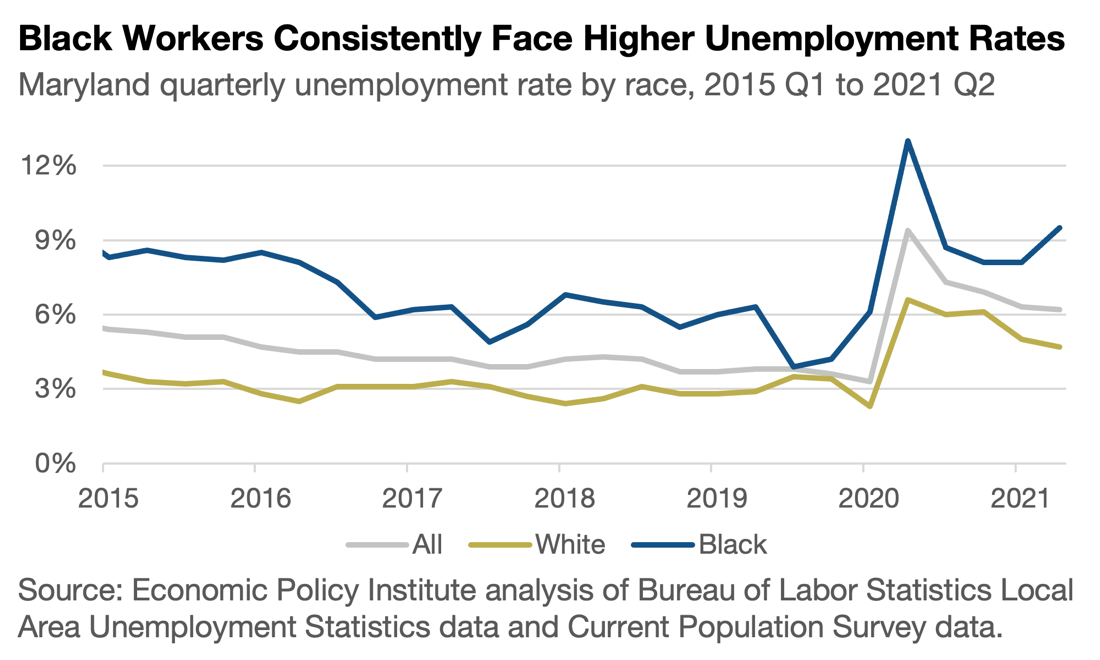
- Because of the specific history of racism in Maryland, Black workers often face some of the highest barriers in our labor market. Between 2015 and 2020, Black workers in Maryland were on average slightly more than twice as likely as white workers to be unemployed – meaning they are actively looking for a job but unable to find one – at any given time.
- More than 12% of Black workers in Maryland were unemployed at the height of the COVID-19 economic crisis, while the white unemployment rate never exceeded 7%. (State-level unemployment snapshot data are not available for other racial and ethnic groups.)
- Our economy has delivered sluggish wage growth to the vast majority of workers over the last several decades, the result of wage suppression policies and corporate efforts to thwart worker organizing. The harm has not been evenly distributed. Black and Latinx workers have experienced slower wage growth during the last decade than their white counterparts, and women’s wages have fallen further behind men’s.
- In 2019, typical Latinx workers in Maryland took home $16.83 per hour (equivalent to $35,000 per year for a full-time worker), compared to $18.65 per hour ($38,800 per year for a full-time worker) among Black workers and $22.36 per hour ($46,500 per year for a full-time worker) among white workers.
- Workers with higher levels of education are less likely to be unemployed and typically take home higher wages, but this does not erase racial and gender inequities. Across multiple racial and ethnic groups, workers of color who hold a four-year college degree are more likely to be unemployed than their white counterparts; are less likely to hold a job that matches their qualifications; and take home lower incomes, even compared to workers in similar occupations.
- There are a wide range of barriers that disproportionately stand in the way of workers of color – in many cases created by policy choices. These include early-life stress that hinders success in school and the labor market, inequitable education funding, lopsided transportation investments, lack of affordable childcare, and others. Hiring and pay discrimination by employers remains an important barrier facing workers of color and women.
- Larger shares of workers of color have a disability than white workers, and workers with disabilities face an additional layer of barriers such as discrimination and failure by employers to provide reasonable accommodations. The result is high unemployment rates and low wages among people with disabilities.
Everyone benefits when our public policies and programs allow all Marylanders to thrive, and the policies we have in place today are holding some people back. We must address obstacles to opportunity based on the color of your skin, your accent, the ZIP code where you were born, or other aspects of who you are.
Maryland’s Investments in Workforce Development
One of the main tools the state has for addressing community needs is through the state budget. Maryland policymakers invested $572 million in workforce development programs in the 2020 budget year (July 1, 2019-June 30, 2020):
- Most of that amount was support for community colleges ($384 million). The state provided $188 million in funding for other workforce development services.
- The federal government is the primary funder for most workforce development programs, accounting for 69% of non-community college funding. State revenue sources provide the remaining 31%.
- Workforce development constitutes slightly more than 1% of the state budget. This includes 1.6% of total state funds (primarily funding for community colleges) and 1.0% of federal grants to the state.
- Public spending on workforce development programs have trended downward in recent years. Declining federal funding is an important contributor to this decline, but state investments in community colleges have also gone down.
- The state is not investing enough in workforce development services and staff to meet Marylanders’ needs. For example, thousands of Marylanders with disabilities are eligible for workforce services but instead sit on a waiting list because of insufficient funding.
Women and workers of color use workforce development services at higher rates than white workers in Maryland, but data suggest that the services they receive often do not set them up for stable, family-supporting employment:
- The majority of participants in most major workforce development programs were people of color in 2019 and 2020, with Black workers constituting the majority in three out of six programs. Women constitute the majority of participants in most services as well.
- While our workforce development services are fairly successful in helping workers obtain employment, most participants subsequently take home paltry wages. Women, Black workers, American Indian workers, and workers with disabilities are especially likely to have low post-participation earnings.
- Many participants in our workforce development system face barriers to employment such as lack of access to transportation, inability to afford childcare, or discrimination due to past incarceration – barriers that in many cases are the result of broader public underinvestment. However, most participants do not receive supportive services that could remove these barriers.
Recommendations to Advance Opportunity for All Marylanders
The are several steps policymakers can take to make our workforce development system more effective and create a healthy Maryland labor market that works for everyone, no matter what you look like or where you live.
- Invest in the Foundations of Thriving Communities: Many of the barriers standing between Marylanders of color and good job opportunities or decent wages are the result of policymakers’ choices to underinvest in basic public services. Providing the things our communities need to thrive would improve job opportunities and strengthen communities in multiple other ways. The state should strengthen investments in affordable housing, public transportation, and childcare; faithfully implement the Blueprint for Maryland’s Future school funding package; and expand health care access.
- Strengthen Worker Protections: Basic protections like wage standards, paid leave, and health and safety requirements are vital for a fair labor market, and these protections are meaningful only if they are robustly enforced. The state should increase funding and staffing at the state agencies responsible for protecting workers and holding unscrupulous employers accountable. State leaders should also explore innovative strategies such as proactive enforcement, and fill in gaps in worker protections such as paid family and medical leave.
- Reform Unemployment Insurance: The COVID-19 pandemic has brought overdue attention to the shortcomings in Maryland’s unemployment insurance system. Thousands of workers endured months of hardship while waiting to receive the benefits they were owed during the last year. Those who do receive benefits still often struggle to keep up with expenses. And outdated eligibility rules took this critical economic support away from thousands of workers when federal emergency unemployment programs expired on Labor Day. The state should fully staff the Division of Unemployment Insurance and maintain sufficient staffing once the economy improves; increase benefit caps and wage replacement rates; and update eligibility rules to include app-based workers, self-employed workers, and other workers who today’s rules exclude.
- Invest in Workforce Development: We should use state funds to ensure that everyone who is eligible for workforce development services and could benefit from them is able to get quality services in a timely manner. The most urgent need is to eliminate the Division of Rehabilitation Services wait list. The state should also ramp up efforts to identify barriers facing participating workers and provide supportive services to remove those barriers. To ensure that workforce development opens up good career opportunities, services should focus training on marketable skills rather than training narrowly tailored to specific employers.
- Insist on Good Jobs: A just and effective labor market is one where every worker is able to get a good job that pays family-supporting wages. Workers who receive workforce development services in Maryland too often exit into low-paying jobs. The state should increase earnings targets, require partner employers to pay decent wages, and exclude employers with histories of labor law violations.
- Build Worker Power: Strong evidence shows that workers have more power to secure good wages, benefits, and working conditions when they join together in labor unions. We can support worker power in our workforce development system by prohibiting partner employers from engaging in union-busting behavior such as holding mandatory anti-union meetings. The state can also protect fiscal investments in workforce development by requiring labor peace agreements and project labor agreements. These agreements should include fair hiring provisions to prevent inequitable barriers to entry.
- Invest in Data: Effective, equitable policy depends on high-quality data. The state should go beyond federal reporting requirements to monitor past participants’ hourly wages, wait lists and unreached eligible workers, specific barriers to employment, and disparities by race, ethnicity, gender, disability, and other equity-relevant characteristics. These data should be made readily available to the public, except as necessary to protect workers’ privacy.
A detailed discussion of these policy recommendations can be found in Section 9.
Defining Workforce Development
Supporting a healthy labor market is among the most important goals of state policy, and nearly every investment the state makes – from educating tomorrow’s workers to housing today’s – contributes to this goal. For this reason, it is challenging to define workforce development as a discrete set of public investments. Reflecting this complexity, Maryland state agencies have within the last decade used definitions of workforce development that include anywhere from $300 million to more than $6 billion in annual state spending.[1]
| What is workforce development?
As the economy has changed over the past several decades, many different organizations have developed programs to support workers, help businesses enhance productivity and solve human resource challenges, reemploy workers who have lost their jobs, and move people from precarious positions on public support to positions of employment and self-sufficiency, among many other unique and targeted approaches to supporting employment and economic opportunity. Collectively, this array of programs and policies makes up the workforce development system. Investing in America’s Workforce, a collaborative led by the Federal Reserve System focusing on workforce development policy[2] Government services to support the training and placement of workers into employment opportunities span a broad spectrum of activities. Elements are found in the public school system, the correctional system, the social services system, and the agencies that oversee labor issues and economic development efforts. Workforce development services generally include matching those seeking jobs with opportunities, providing skills-based training, and facilitating access to apprenticeships to connect the unemployed and underemployed with work opportunities. Maryland Department of Legislative Services, 2018 Legislative Handbook Series Vol. II[3] |
This report identifies state investments in workforce development based on three goals that appear as common themes in definitions of the term (see box for examples):
- Fostering a skilled workforce
- Removing barriers to employment
- Supporting economic development
This report narrows its focus based on two additional factors:
- Workforce Innovation and Opportunity Act (WIOA): WIOA is the central federal law governing workforce development services. This report focuses especially, but not exclusively, on the core WIOA programs (see box for more information).
- State Fiscal Significance: The focus of this report is state investments in workforce development. While the federal government is the primary funder of most workforce development services in the state budget, most services include at least some state funding. This report excludes programs that are entirely federally funded or that generate their own funding. Among state-supported services, this report gives primary focus to those with substantial fiscal significance.
Table 1 summarizes Maryland’s workforce development system. The table notes programs that administer the six WIOA core programs in Maryland and identifies workforce development programs that do not receive significant state support and are therefore excluded from this report.
| Table 1. Maryland’s Investments in Workforce Development | |
| Program | Note |
| MDL Workforce Development | Core Focus – WIOA Titles I, III |
| Adult Education and Literacy | Core Focus – WIOA Title II |
| MSDE Division of Rehabilitation Services* | Core Focus – WIOA Title IV |
| EARN Maryland | Included |
| Governor’s Workforce Development Board | Included |
| MDL Apprenticeship and Training | Included |
| Correctional Education | Included |
| Partnership for Workforce Quality | Included |
| Community Colleges including BCCC | Included |
| TCA Work Opportunities | Excluded – Not State Supported |
| Maryland Office for Refugees and Asylees | Excluded – Not State Supported |
| Maryland Correctional Enterprises | Excluded – Not State Supported |
| * For purposes of this report, MSDE Division of Rehabilitation Services excludes Disability Determination Services, which shares responsibility for determining eligibility for Social Security Disability Insurance. | |
Other Investments Shape Maryland’s Labor Market
Workforce development represents only a small subset of the investments that shape Maryland’s labor market, and which have the power either to move us toward justice and inclusion or to further entrench inequity. In fact, many of the barriers workforce development services seek to remove exist only because we have neglected these other investments. Accordingly, an equity-focused analysis of our workforce development budget must also consider two broader categories of public service:
- Foundations of thriving communities: Investments in housing, health care, public education, transportation, and other essentials that allow Maryland communities – including the labor market – to function
- Worker Protections and Supports: Investments with direct relevance to the effective and equitable functioning of the labor market, such as unemployment insurance and enforcement of worker protections
| Program | Foundations of Thriving Communities | Worker Protections and Supports |
| All state investments not belonging to other categories, including: | X | |
| Pre-K-12 Education | X | |
| State Four-Year Colleges and Universities | X | |
| Transportation | X | |
| Childcare Subsidies | X | |
| Unemployment Insurance | X | |
| Maryland Commission on Civil Rights | X | |
| Employment Standards Service | X |
| WIOA 101
The Workforce Innovation and Opportunity Act (WIOA) is the central federal law governing workforce development services. Congress passed the law in 2014, succeeding the Workforce Investment Act of 1998. The law traces its historical roots to the New Deal-era Wagner-Peyser Act of 1933 and the Manpower Development Training Act of 1962. WIOA includes six core programs:[4]
|
| Does Maryland Have a “Skills Gap”?
Many stakeholders in the workforce development arena argue that a broad mismatch exists between the skills workers possess and the skills employers are seeking, and therefore focus on policies to help workers develop these sought-after skills. For example, according to the National Skills Coalition, “A majority of jobs (52%) require skills training beyond a high school, but not a four-year degree. But too few of America’s workers – just 43% – have had access to the skills training necessary to fill these in-demand careers.”[8] However, the evidence for widespread “skills gaps” is mixed at best. Economic research shows that many of the phenomena often attributed to skills gaps – from slow wage growth to pockets of persistently high unemployment – are primarily the product of wage suppression policies, discrimination, market power held by large employers, and unrealistic job qualification requirements.[9] |
All of us – whether white, Black, or Brown – deserve the chance to get a good job that pays enough to provide a decent standard of living. However, data show that workers of color in Maryland face a persistently tougher labor market than for their white counterparts because of a range of barriers to opportunity, often created as a result of specific policy choices in the past. Black workers in particular face notable barriers because of the legacy of anti-Black racism in Maryland and nationwide, and labor policies and practices that decision-makers created within that context:
- Between 2015 and 2020, Black workers in Maryland were on average slightly more than twice as likely as white workers to be unemployed – meaning they were actively looking for a job but unable to find one – at any given time.[10] This means that downturns such as the one caused by the COVID-19 pandemic hit Black workers especially hard.
- Conversely, it also means that a robust, effective response to protect jobs can disproportionately protect Black workers.
- Because of racism baked into our economy, even a superficially strong labor market tends to leave large numbers of Black workers unemployed. In more than half of quarters between 2016 and 2019, Maryland’s overall unemployment rate was less than 4% but the unemployment rate among Black workers was more than 6%.[11]
Quarterly unemployment data do not exist for other racial groups in Maryland.
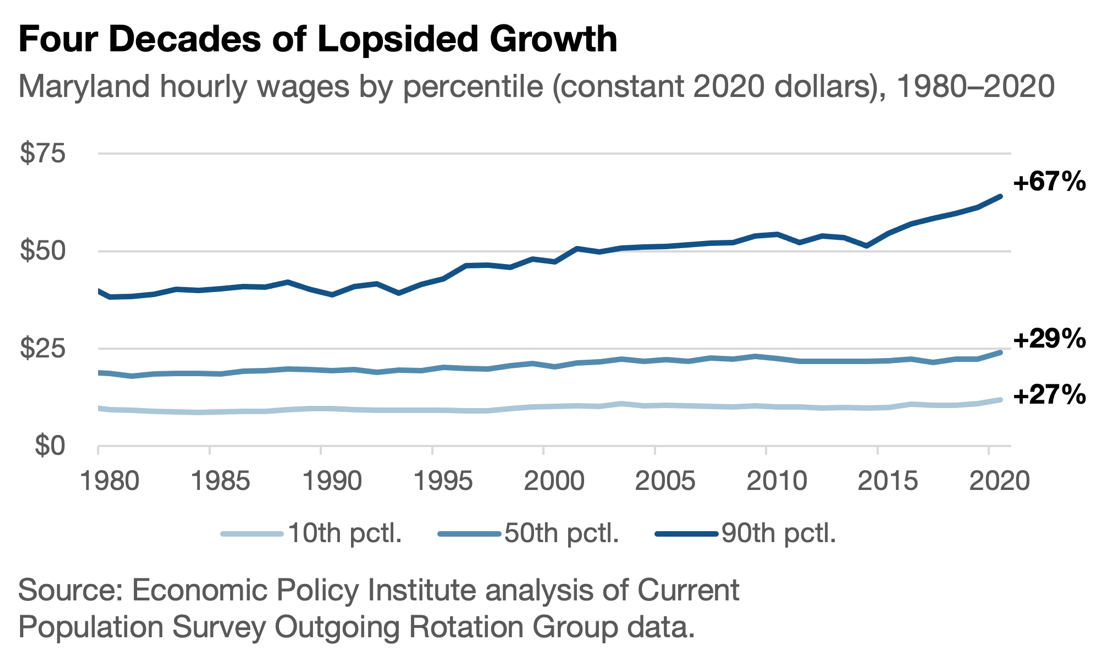
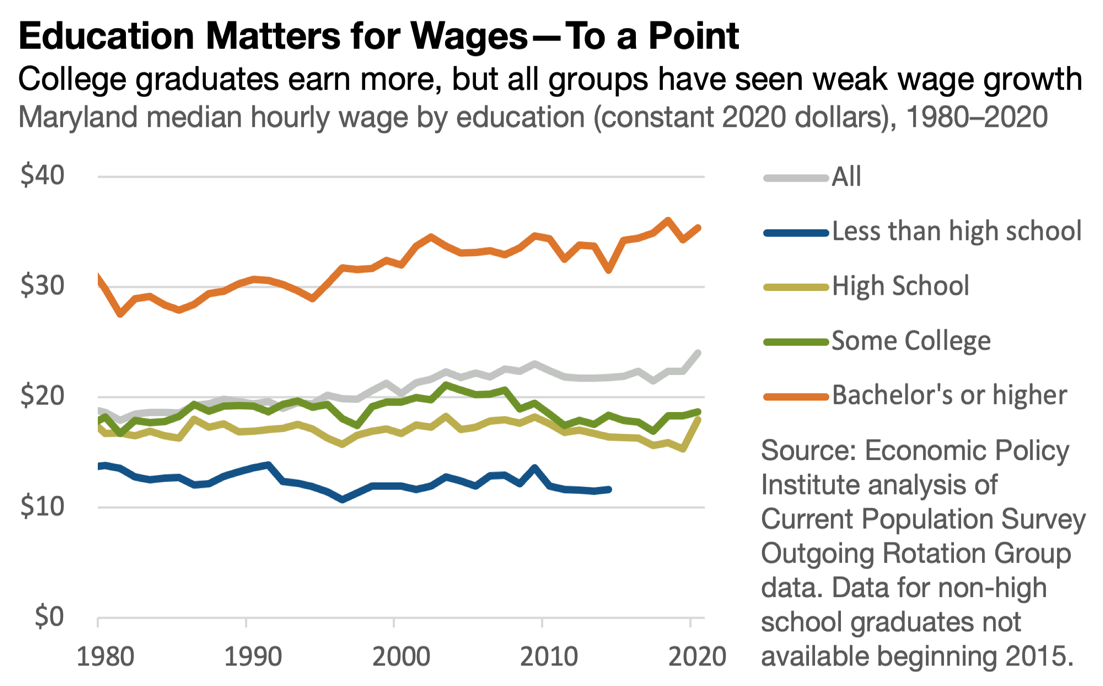
Another dynamic shaping the experiences of Maryland workers is growing wage inequality. Maryland’s labor market today is the culmination of 40 years of stagnating wages for most, as a few at the very top see stratospheric growth. Since the early 2000s, inflation-adjusted hourly wages for earners at the 90th percentile have grown almost three times faster than wages at the middle of the distribution.[12] Even this understates the extent of the explosion of top incomes. Nationwide, the top 0.1% took home salaries and other employment-related income nearing $3 million on average in 2019, more than 20 times the average incomes of the “near-rich” between the 90th and 95th percentiles (average annual income $130,000 in 2019).[13]
Widening inequality harms working people of all racial and ethnic backgrounds. At the same time, current and historical policy choices disproportionately push these harms onto workers of color, particularly Latinx and Black workers:
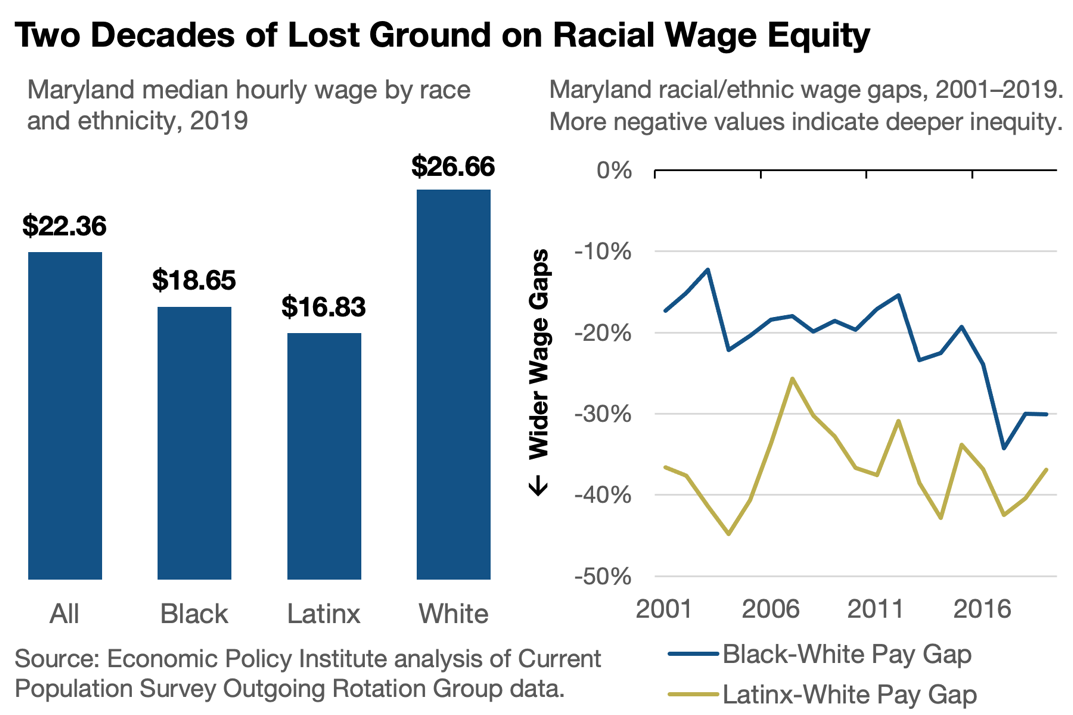
- In 2019, typical Latinx workers in Maryland took home $16.83 per hour, compared to $18.65 per hour among Black workers and $22.36 per hour among white workers.
- In 2001, typical Black workers took home 17% less for each hour worked than their white counterparts; in 2019, they took home 30% less than typical white workers.
- Typical Latinx workers in Maryland took home 37% less than their white counterparts in 2019, the same disparity as existed in 2001. However, Latinx workers have lost ground gained between the turn of the century and the onset of the Great Recession.
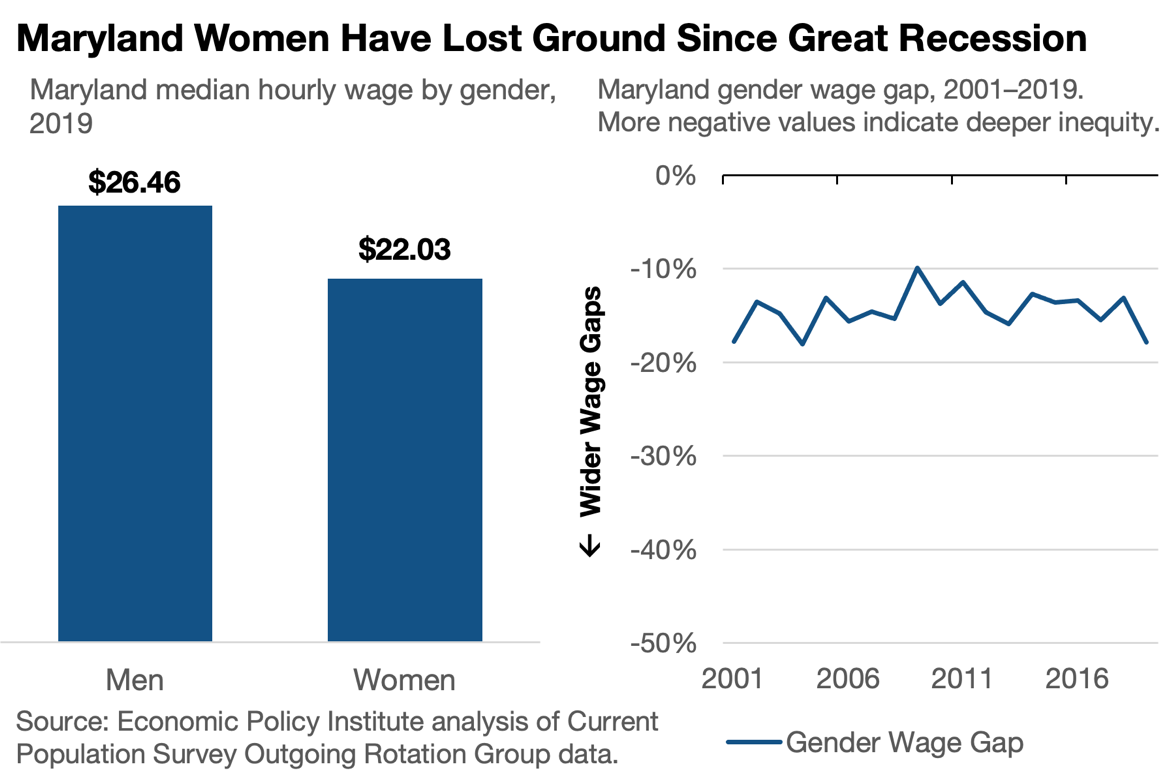
A similar dynamic has affected working women in Maryland in recent years. Women in Maryland made enormous wage gains in the last years of the 20th century, shrinking the gap between men’s and women’s typical hourly wages from 36% in 1979 to only 13% in 2000. However, that progress slowed after the turn of the century and has reversed slightly since the Great Recession. Women in Maryland typically took home 10% less than men in 2009, but as of 2019 they took home 18% less. While only limited data currently exist on the effect of the COVID-19 pandemic on wages, the pandemic has hit women especially hard, leaving many jobless or juggling work with increased care responsibilities.[14]
Consistent with evidence that strong support for public schools can improve children’s future earning potential, Maryland workers with a bachelor’s degree or higher take home considerably more than those with lower levels of education. This gap has grown in recent years, with the ratio of median wages for Maryland workers with at least a bachelor’s degree to those of workers with a high school diploma increasing from 1.83 in 2007 to 2.24 in 2019.[15]
This trend comes with two caveats:
- First, these data do not distinguish between workers with a bachelor’s degree and those with a graduate or professional degree. If the share of four-year degree holders with an advanced degree has increased, rising wages among those with at least a bachelor’s degree could reflect this compositional change.
- Second, as discussed in detail in the next section, education does not deliver the same wage gains for everyone. Because of hiring and wage discrimination, even highly educated women and workers of color do not have the structural advantages that policy choices have created for white men.
In recent years, increasing wage inequality has been driven mostly by the growing gap between those at the top and everyone else. Encouragingly, low-wage workers have drawn somewhat closer to those in the middle of the distribution since the Great Recession. This partly reflects slow wage growth for those in the middle, but it also shows the positive power of raising the minimum wage to lift incomes for low-wage workers.[16]
| Workforce Development and Economic Development
Workforce development can serve as a tool for assisting businesses and attracting investment. For example, the 2020 annual report for Employment Opportunities Right Now (EARN Maryland), a flagship Maryland workforce development program that has gained national attention, states, “The primary goal of EARN Maryland is to improve the business climate in the State through the cultivation of more highly skilled workforce.”[18] In fact, federal law requires that business representatives constitute the majority of membership on each state’s Workforce Development Board, the chief state-level body that makes policies affecting the workforce.[19] Research has indeed found that skills training is more effective in attracting business investment than business subsidies.[20] While workers and employers both benefit from a healthy economy, a narrow focus on businesses’ priorities can limit our ability to advance equity through workforce development policies. Intentionally targeting equity can guide us toward more beneficial policy choices, such as teaching marketable skills and pairing recruiting assistance with strong wage standards. |
The trends discussed in the previous section mask some of the complexity in Maryland’s labor market – and in the structural barriers that hold workers of color back. For example, the large and growing difference between typical wages for workers with a four-year degree and those without one may suggest that focusing on education is the key to labor market equity. Fully and equitably funding public schools would indeed make a difference. However, a deeper dive into the data show that discrimination remains a significant barrier to equity. For example:[17]
- Workers of color – especially, but not only, Black workers – have a harder time finding any job than white workers with the same level of education.
- Workers of color who have a four-year college degree have a harder time than white workers in finding a job that matches their qualifications.
- Workers of color typically take home less than white workers, even those with the same level of education and working in the same occupation.
These facts underscore the need for a multipronged approach to investing in Maryland’s workforce. Education is essential, but so are factors like removing barriers to employment, enforcing worker protections and anti-discrimination laws, and setting strong job quality standards.
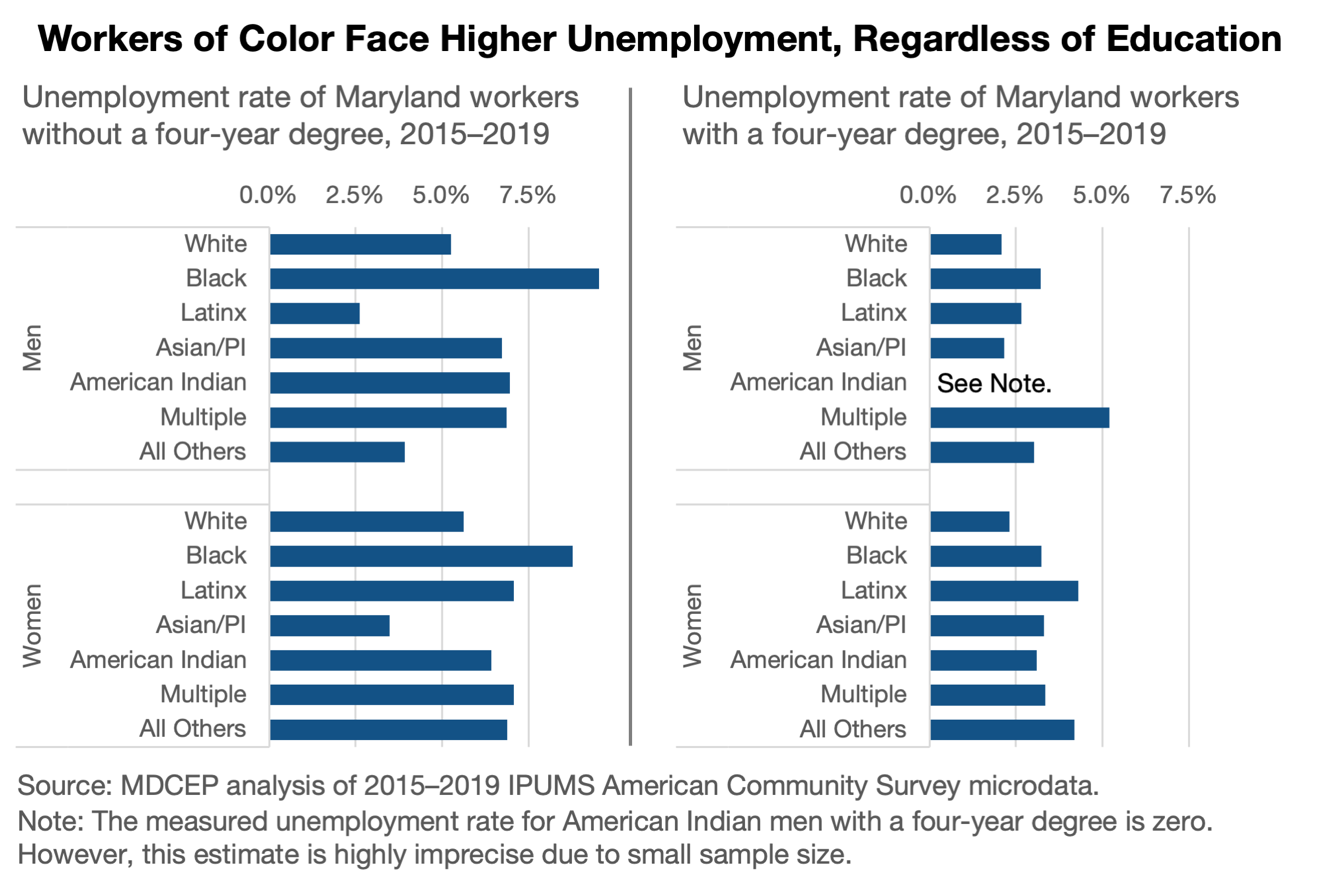
While workers who hold a four-year college degree are less likely to be unemployed – actively searching for a job but unable to find one – than those without one, substantial racial disparities exist even when comparing workers with the same level of education.[21]
- For example, between 2015 and 2019 in Maryland, the average unemployment rate among working-age Black women without a four-year degree was 8.8%, compared to 5.6% among white women without a four-year degree.
- Similarly, between 2015 and 2019 in Maryland, the average unemployment rate among Latinx women with a four-year degree was 4.3%, compared to 2.3% among white women with a four-year degree.
- These are not isolated cases. During the same period, Black and multiracial men with a four-year degree, as well as essentially all women of color with a four-year degree, faced higher unemployment rates than white men with the same level of education.
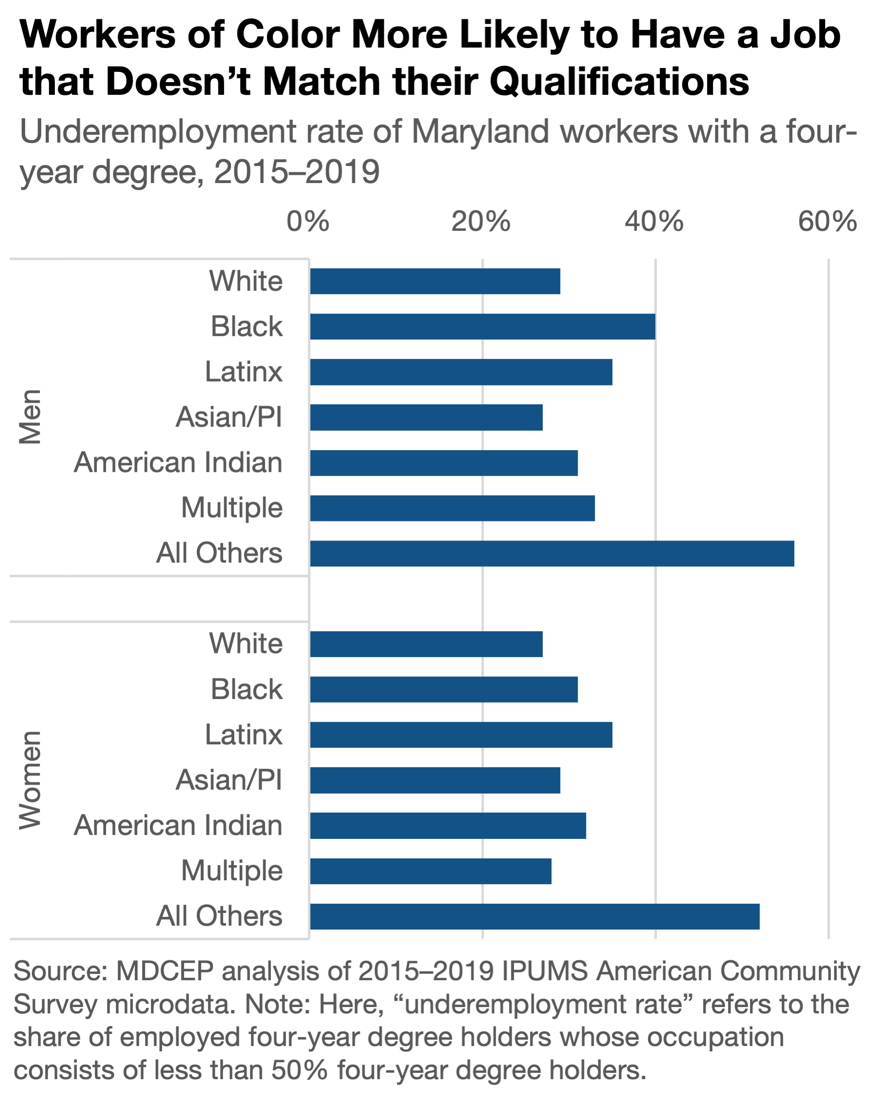
While structural barriers prevent many workers of color in Maryland from obtaining any job, even those who clear this hurdle are less likely than white workers to get a job that matches their qualifications.[22]
- For example, between 2015 and 2019 in Maryland, 39% of Black men with a four-year degree worked in occupations typically held by non-four-year degree holders (hereafter “non-four-year occupations” or “occupations not requiring a four-year degree”), compared to 29% of white men with a four-year degree. In other words, highly educated Black men in Maryland have more difficulty finding a job that matches their qualifications than their white counterparts.
- The same goes for four-year degree holders who are Black women, Latinx men and women, and men and women belonging to racial groups not specifically identified in Census data.
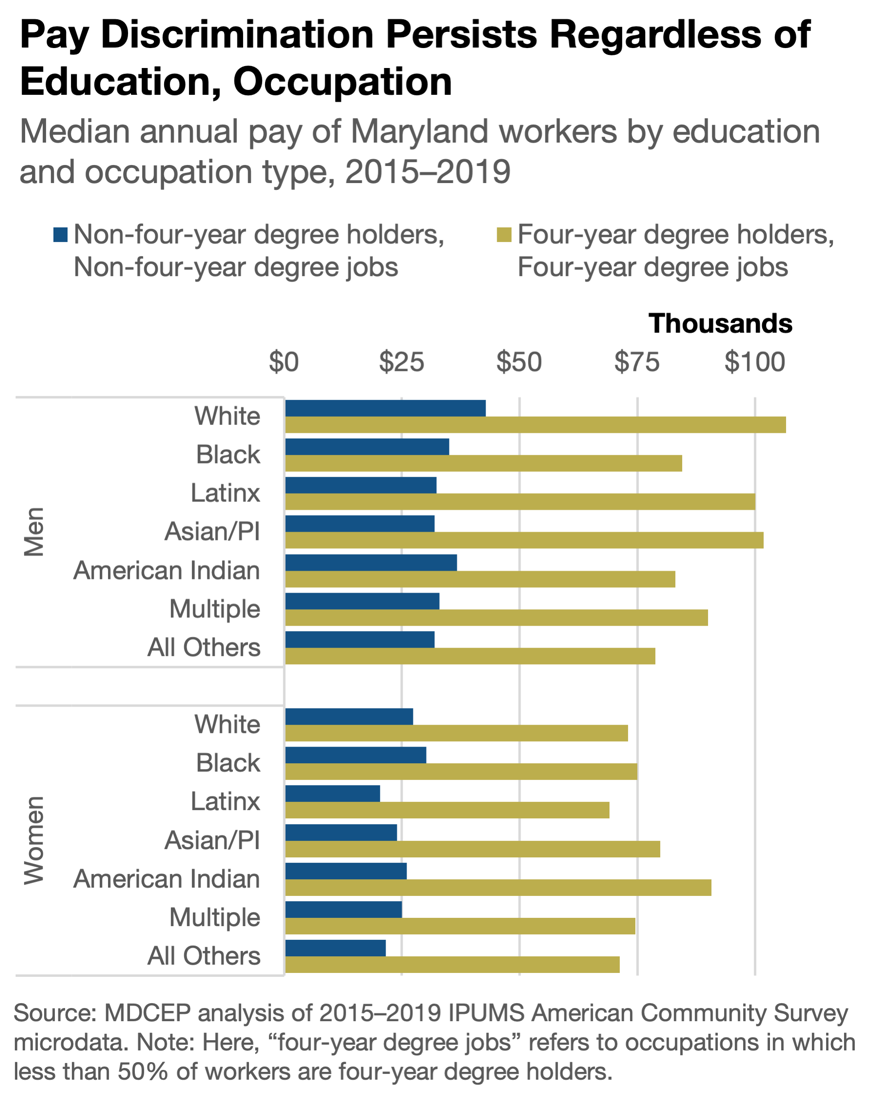
Pay discrimination forms an additional barrier. Even after finding a job that matches their qualifications, women and workers of color in Maryland are typically paid less than otherwise similar white or male workers.[23]
- For example, between 2015 and 2019 in Maryland, Asian men who did not have a four-year degree and worked in an occupation that did not require a degree typically earned $32,000 per year, compared to $43,000 among their white counterparts.
- Similarly, between 2015 and 2019 in Maryland, Black men who had a four-year degree and worked in an occupation requiring a four-year degree typically earned $85,000 per year, compared to $107,000 among their white counterparts.
- The combination of race-based and gender-based pay discrimination takes an especially large toll on women of color. For example, Latinx women with a four-year degree who worked in an occupation requiring a four-year degree typically took home only $69,000 between 2015 and 2019.
Workers with disabilities
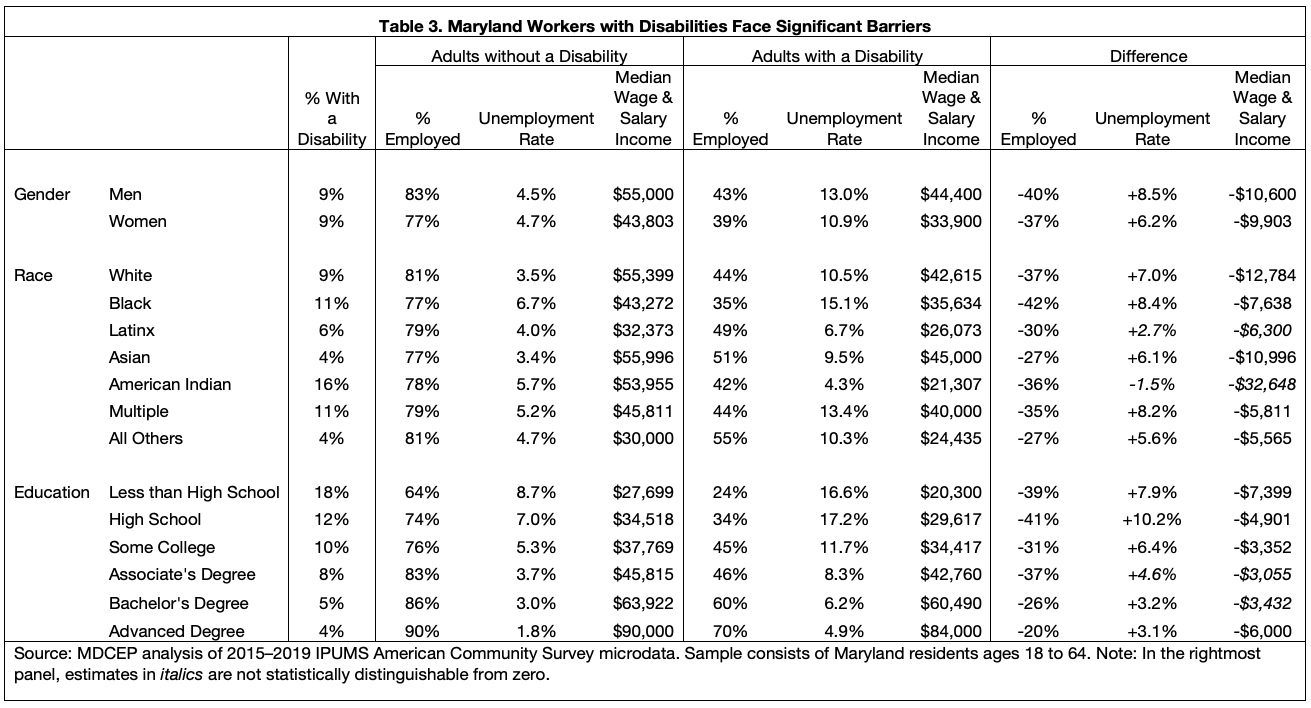
Workers with disabilities face additional barriers in the labor market because employers discriminate against them in hiring or compensation decisions or fail to provide reasonable accommodations as required by the Americans with Disabilities Act. Mistreatment of workers with disabilities intersects with and compounds racial injustice in the labor market.[24]
- Between 2015 and 2019, about 9% of working-age Marylanders (340,000 people altogether) had one or more disabilities reported in the American Community Survey.
- Among working-age adults, American Indian Marylanders are most likely to have an identified disability, followed by Black and multiracial Marylanders. Asian and Latinx Marylanders are less likely than those in other racial groups to report a disability.
- While Marylanders at higher educational levels are less likely to report a disability, about 86,000 working-age Marylanders with a college degree have a disability.
Marylanders with disabilities face more barriers in the labor market than Marylanders who don’t have a disability, across racial, ethnic, gender, and educational groups.
- Across nearly all demographic groups, Marylanders with disabilities have a higher unemployment rate than those without a disability. This means that a larger share of workers who want a job are unable to find one. For example, the unemployment rate among men with a disability in Maryland is 13.0%, compared to 4.5% among men without a disability.
- When workers with disabilities do find a job, they typically take home less than workers who do not have a disability. For example, employed Latinx workers with a disability typically take home $26,100 per year, compared to $32,400 among those who do not have a disability.
Disparate outcomes in employment, wages, and working conditions are ultimately the result of barriers built through policy choices – including when policymakers have made the choice to do nothing when faced with a solvable problem. Many workers face multiple, stacked obstacles that build up beginning in childhood, especially when they belong to intersecting marginalized groups (such as workers of color who have a disability).
Housing
- Decades of deliberate racial segregation continue to limit the options available to Marylanders of color when deciding where to live, including families with moderate or high incomes. For example, Black families with annual income between $100,000 and $125,000 on average live in neighborhoods with lower incomes and higher poverty rates than white families with income between $60,000 and $75,000.[25]
- Black children are exposed to environmental hazards in and near their homes at higher rates than white children.[26] Between 2012 and 2014, Black children in Maryland were twice as likely as white children to have asthma. In 2016, children in Baltimore City were five times as likely as those in other counties to have lead poisoning, with the highest rates among those living in rental housing built before 1950. Black households are more than twice as likely to live in this housing type as white households.
| Table 4. Racial Neighborhood Segregation Across Income Groups | ||
| Average Neighborhood Income | ||
| Household Income | White | Black |
| $60,000 to $74,999 | $108,000 | $89,000 |
| $75,000 to $99,999 | $112,000 | $95,000 |
| $100,000 to $124,999 | $118,000 | $100,000 |
| Neighborhood Poverty Rate | ||
| Household Income | White | Black |
| $60,000 to $74,999 | 8.6% | 11.8% |
| $75,000 to $99,999 | 7.9% | 10.6% |
| $100,000 to $124,999 | 7.2% | 9.3% |
| Source: MDCEP analysis of 2015–2019 American Community Survey five-year estimates. | ||
Economic Insecurity
- Children who grow up amid economic insecurity are more likely to experience traumatic stress and anxiety that can affect brain development.[27] Research shows that children in low-income families are more likely to exhibit biological stress markers such as higher blood concentration of stress hormones and elevated resting blood pressure – and that these effects on the body can make it harder to succeed in school and beyond. Researchers have found that simultaneous exposure to multiple risks has a cumulative effect on children’s physiological and psychological development beyond the effect of each risk in isolation.
Education
- Cutbacks in public school funding since the onset of the Great Recession have deprived children of color in Maryland of a good education that can set them up for success in adulthood. As of 2017, more than half of Black students in Maryland went to school in a district that was underfunded by 15 percent or more compared to state standards – which are themselves inadequate to meet today’s academic expectations.[28] Only about one in 12 white students went to school in a district this deeply underfunded. While the state is now rebuilding its investments in public schools through the Blueprint for Maryland’s Future, these past underinvestments continue to harm people who are in the workforce today. High-quality research shows that sufficient public school funding makes a big difference for children’s future economic prospects.[29]
Transportation
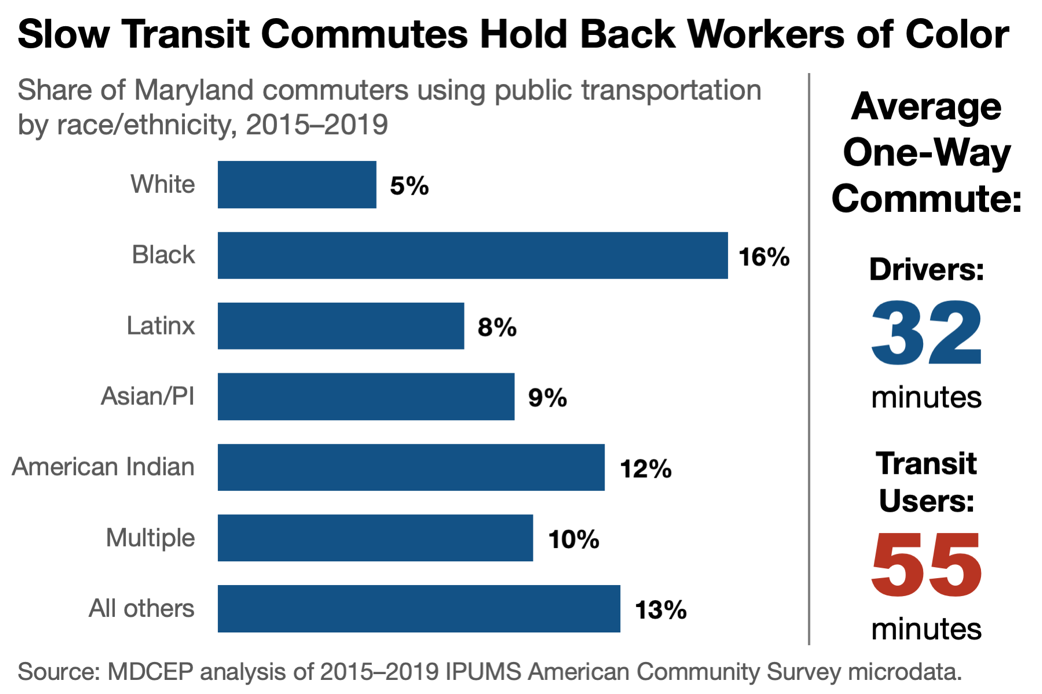
- As a result of our past choices about where and how to invest in our transportation system, Black Marylanders have longer average commutes to work than their white counterparts. The difference is widest in areas of our state where workers of color live in the highest numbers.[30] In some areas, Black workers commute up to 55 hours more each year than their white neighbors.
- Neighborhood segregation and racial income disparities – both the products of centuries of racist policy choices – make transportation policy in Maryland unavoidably racialized. About one in six Black workers in Maryland take public transportation to get to work, compared to only one in 20 white workers.[31]Workers in other racial and ethnic groups are about twice as likely to commute via transit as their white counterparts.
- On average, it takes transit commuters in Maryland just over 50 minutes to get to work each day, plus another 50 minutes to get back home.[32] Average car commutes are a little over 30 minutes each way. Over the course of a year, this adds up to about a week of extra commuting time for a full-time worker.
- On average, workers in the Baltimore metro area can reach only 8% of jobs in the region by transit in one hour or less.[33]In the year after the BaltimoreLink transit overhaul, the region saw the biggest drop in transit accessibility among the nation’s 50 largest metro areas.
- By car, 100% of jobs in the Baltimore region are accessible within an hour. In fact, there are more jobs within a 20-minute drive of an average Baltimore-area worker than within an hourlong transit ride.
- In the Washington, DC, metro area (including portions outside Maryland), workers can on average reach 10% of the region’s jobs in an hour via transit or 85% in an hour by car.
Childcare
Care responsibilities are among the most important barriers many workers face, with childcare chief among them. Childcare responsibilities are among the top reasons Maryland adults cite for why they are not currently employed,[34] and the cost of childcare can eat up much of the income a person might earn, especially at a low-wage job.
Childcare assistance is an important lifeline for working parents, but it leaves too many behind.
- Because childcare assistance is part of the federal discretionary budget (instead of a mandate), Congress is not required to – and does not – provide enough funding to aid all eligible children.
- For many years, thousands of Maryland children sat on a waiting list, unable to access care even though they were eligible.
- A significant increase in federal funding allowed the state to expand childcare assistance in 2018, eliminating the waiting list, enabling more parents to access assistance, and lowering out-of-pocket costs.
- However, increased investment would enable thousands more families to access childcare. The U.S. Department of Health and Human Services estimates that about 300,000 Maryland children were potentially eligible for assistance in 2017 and 2018 under federal rules, and 160,000 qualified under state rules.[35]
- Even after the recent expansion, only about 19,500 Maryland children received childcare assistance in an average month in 2019.
Federal and state underinvestment also limit families’ access to high-quality childcare, even if they receive assistance.
- The federal government recommends that states pay childcare providers at a rate that is greater than or equal to the amount charged by 75% of providers, the 75th percentile of market rates.[36]
- During the 2017–2018 budget year, the state paid only the 11th percentile of childcare providers’ rates, meaning that 89% of providers would have to either accept a lower amount or charge parents the balance.[37]
- The state has since made a great deal of improvement, but payment rates remain below the federal recommendation. Payment rates in Maryland have been equal to the 60th percentile of market rates since November 2020.
Restrictive eligibility rules are another barrier to accessing childcare, especially for unemployed workers. This puts parents in a catch-22 – they can’t get childcare unless they have a job, but it’s risky to take a job without knowing if you will be able to afford childcare.[38]
- If a parent loses their job while receiving childcare assistance, Maryland rules allow the parent to continue receiving assistance for up to 90 days (unless their 12-month eligibility period ends sooner). This is only slightly longer than the minimum “grace period” required by the federal government.
- Maryland could take a different approach to better support working parents. Twelve states allow parents to continue receiving childcare assistance after a job loss until the end of their 12-month eligibility period, including our neighbors Pennsylvania, the District of Columbia, and Virginia, plus states as disparate as California and Louisiana.
- In most cases, parents in Maryland are not able to apply for childcare assistance if they are not currently employed. Eleven states allow parents to begin receiving assistance while out of work, including our neighbor West Virginia.
- Maryland does make some exceptions for parents receiving Temporary Cash Assistance or Supplemental Security Income, but this helps only a tiny minority of parents.
Prior Incarceration
When a person returns to the community from incarceration, the interaction of harmful economic and legal policies can limit job opportunities and make it even harder to stay out of prison:[39]
- While Maryland has taken some positive steps to limit the practice in recent years, companies are still allowed to ask about applicants’ criminal record as part of the hiring process. Similarly, state licensure rules limit opportunities by disqualifying people with prior convictions for some occupational licenses, including for occupations unrelated to a person’s specific conviction.
- Counterproductive rules prohibit people with prior convictions from using some economic security benefits, such as housing assistance. The added strain of having to scramble to meet basic needs – or being unable to meet those needs, such as if a person experiences homelessness – can get in the way of a successful job search.
- Inadequate access to evidence-based approaches to substance use disorders, such as medication-assisted treatment – both in prison and after release – can make it harder to avoid relapse and as a result hinder success in the labor market.
Because of these and other factors, people often struggle to find decent work after returning to the community. Less than half of people who are released from prison nationwide report any income from a job in the year of their release, and only about 60 percent report job-related income in the following year. Less than half of those who do find a job take home more than $15,000 per year.
Within the narrower scope of public investments labeled as workforce development, Maryland policymakers directed $572 million in funding for workforce development activities in the 2020 budget year (July 1, 2019 to June 30, 2020):[40]
- Most of that amount was support for community colleges ($384 million). The state provided $188 million in funding for other workforce development services.
- The federal government is the primary funder for most workforce development programs, accounting for 69% of non-community college funding. State sources provide 31% of funding for workforce development services other than community colleges.
- Because federal funding for community colleges goes directly to institutions, the majority of this funding is not included in the state budget. Because it is a state agency, the state budget does include $14 million in federal funding for Baltimore City Community College, accounting for 4% of community college funding in the state budget.
- Altogether, workforce development constituted 1.3% of the state budget (excluding higher education funds) in FY 2020. This includes 1.6% of state funds (primarily community colleges) and 1.0% of federal funds.
Table 5 summarizes Maryland’s investments in workforce development.
| Table 5. Maryland’s Investments in Workforce Development (FY 2020, $ millions) | ||||||
| % of Total | ||||||
| Agency | Program | State Funds** | Federal Funds | Total Funds | Incl. CC | Excl. CC |
| MDL | Governor’s Workforce Development Board | $0.5 | $0.0 | $0.5 | 0% | 0% |
| MDL | MDL Workforce Development | $4.4 | $68.2 | $72.6 | 13% | 39% |
| MDL | Adult Education and Literacy | $8.6 | $10.3 | $18.9 | 3% | 10% |
| MSDE | Division of Rehabilitation Services* | $16.3 | $51.8 | $68.1 | 12% | 36% |
| MDL | Correctional Education | $18.5 | $0.0 | $18.5 | 3% | 10% |
| MDL | EARN Maryland | $8.5 | $0.0 | $8.5 | 1% | 5% |
| Commerce | Partnership for Workforce Quality | $1.0 | $0.0 | $1.0 | 0% | 1% |
| MHEC, BCCC | Community Colleges | $370.5 | $13.9 | $384.3 | 67% | |
| Total | $428.3 | $144.1 | $572.4 | |||
| % | 75% | 25% | 100% | |||
| Total ex. Community Colleges | $57.8 | $130.3 | $188.1 | |||
| % | 31% | 69% | 100% | |||
| * Division of Rehabilitation Services excludes Disability Determination Services.
** State funds include general funds, special funds, and reimbursable funds from non-workforce development sources. Reimbursable funds from workforce development sources are excluded to prevent double-counting. |
||||||
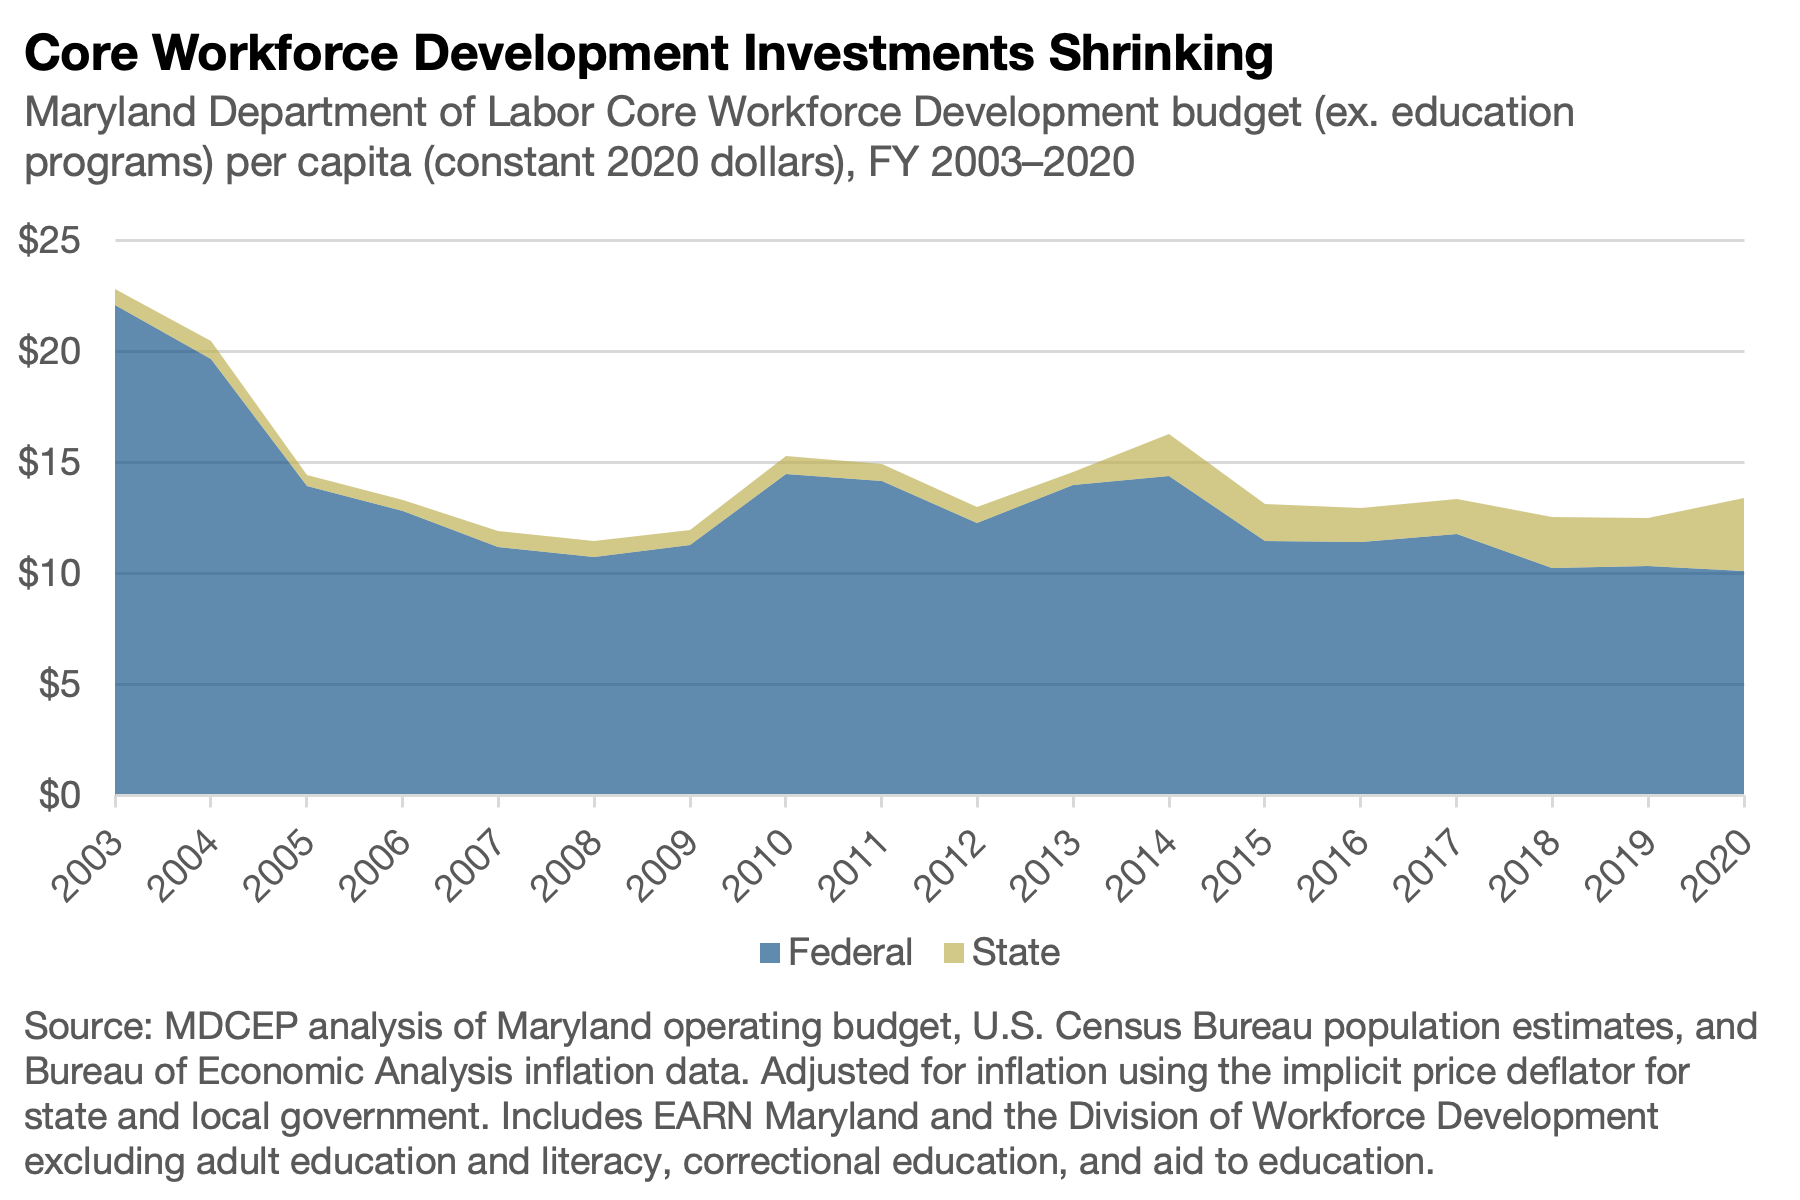
Our investments in workforce development have generally declined since the turn of the century. This has been driven in large part by a downward trend in federal funding:[41]
- Federal funding for the Division of Workforce Development and Adult Learning within the Maryland Department of Labor in the current year’s budget is essentially equal in dollar terms to its level in the 2003 budget year ($76.0 million compared to $74.1 million), excluding programs that migrated from the Maryland State Department of Education to the Maryland Department of Labor during this period.
- However, significant upward and downward swings occurred during this period, with a minimum of $46.8 million in FY 2007 and a maximum of $77.4 million in FY 2014.
- Adjusted for inflation and population growth, federal funding dropped by half from FY 2003 to FY 2019 (the last fiscal year for which actual inflation and population data are available), from $21.65 per capita to $10.23 per capita, in constant FY 2019 dollars.
- State funding (excluding federal dollars) for workforce development programs fluctuated substantially during this period. From FY 2003 to 2013, state investments in the Division of Workforce Development and Adult Learning (excluding programs that changed agencies) varied between $0.50 per capita in FY 2019 dollars (FY 2006) and $0.81 (2010).
- State investments increased substantially beginning in FY 2014 with the establishment of Employment Advancement Right Now (EARN Maryland), a business-focused workforce development program housed outside the Division of Workforce Development and Adult Learning. Including EARN brings the FY 2019 total to $2.11 per capita, three times the FY 2003 level.
- Despite the increased state investment in EARN Maryland, total state and federal investments in the programs considered here declined by 45% from FY 2003 to 2019.
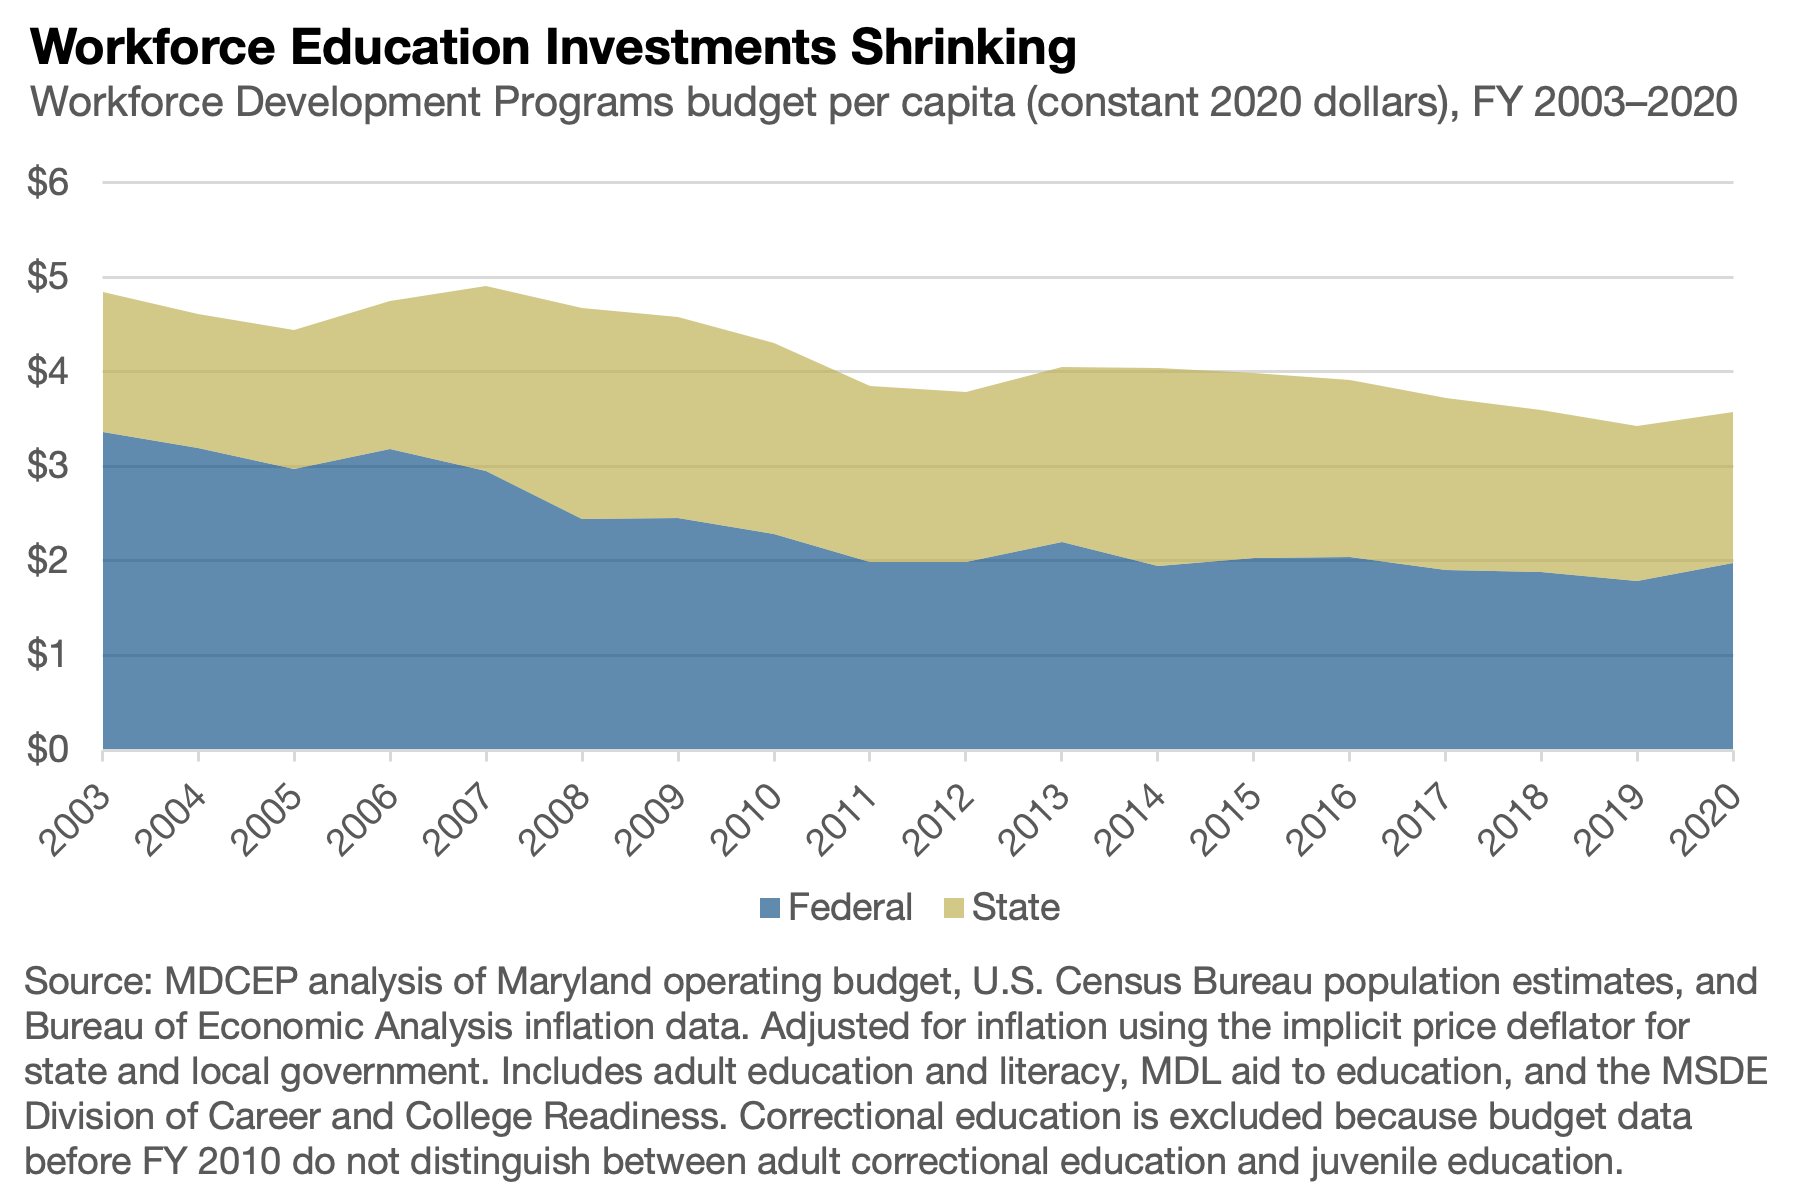
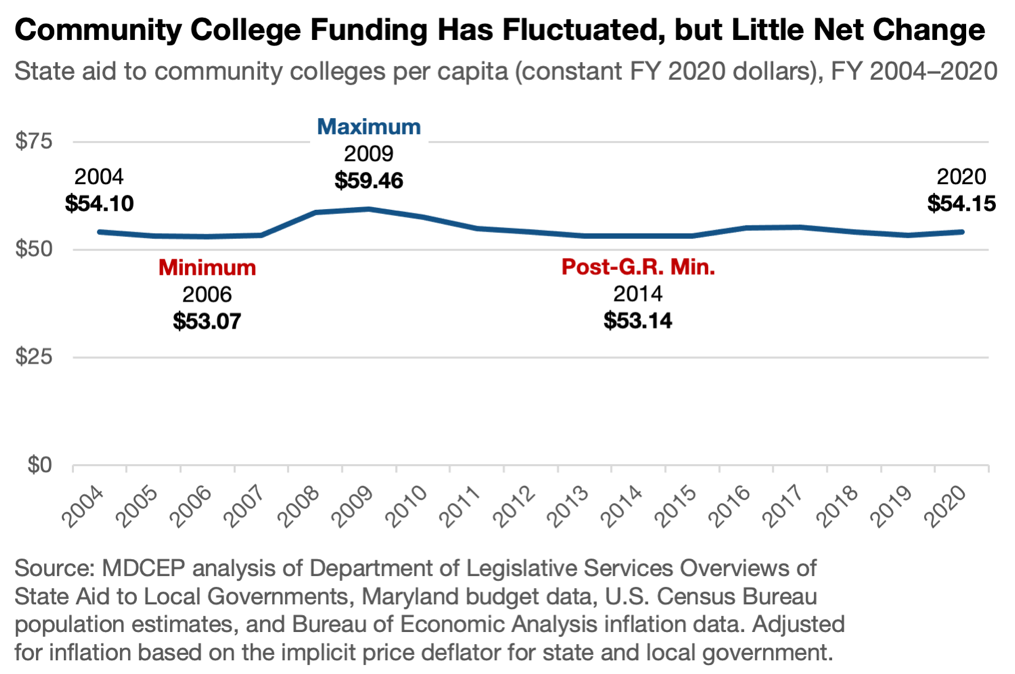
State investments in community colleges have fluctuated considerably since the early 2000s:[42]
- Adjusted for inflation and population growth, state investments in community colleges changed little from $54.10 per capita (FY 2020 dollars) in FY 2004 to $54.15 per capita in FY 2020.
- However, community college investments fluctuated significantly during this period, hitting a high of $59.46 per capita in FY 2009 and bottoming out at $53.07 per capita in FY 2006 and $53.14 per capita in FY 2014.
- While there are not population and inflation data to make possible an apples-to-apples comparison, state investments in community colleges have grown at a faster rate recently, due in part to the establishment of the Promise Scholarship program enabling some students to attend community college with no tuition after financial aid.
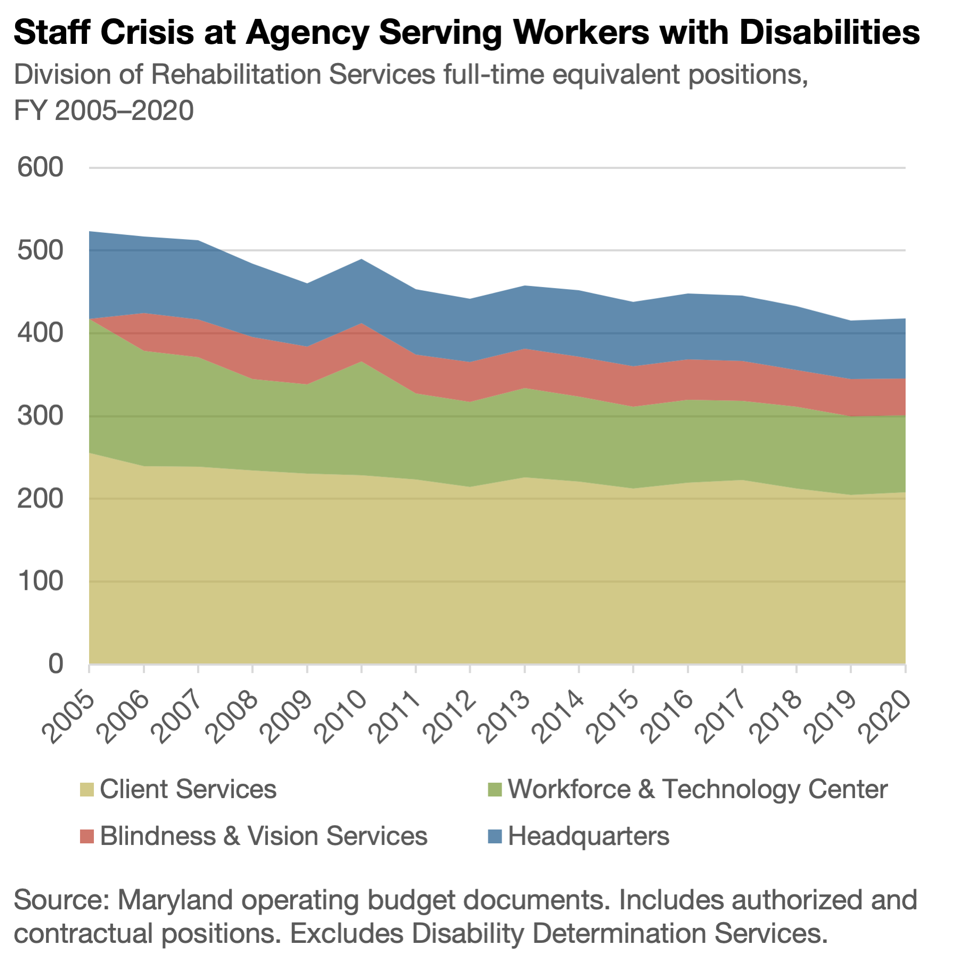
Substantial Unmet Need for Vocational Rehabilitation
- As of June 2020, at least 2,931 people with disabilities were on the waiting list to receive services from the Division of Rehabilitation Services.[43] The agency stopped publishing the length of the waiting list later that summer. As of June 2020, the agency projected that many people would likely wait up to 32 months to receive services. The state reports that the wait list includes 41 people who are experiencing homelessness and 653 people who have been out of work for longer than six months.[44]
- In the state’s most recent state plan required under the federal Workforce Innovation and Opportunity Act, the Division of Rehabilitation Services describes the waiting list and delays in service provision as “the most important barrier to [vocational rehabilitation] services for individuals with significant disabilities in Maryland,” continuing that “individuals on the waiting list are the most seriously unserved of populations.”[45]
- The division attributes the persistent wait list to three factors: (1) arbitrary federal funding constraints; (2) sharp staffing reductions “due to statewide budget constraints and the State’s desire to reduce the overall size of the State’s workforce”; and (3) a destructive cycle of high caseloads, high turnover, and inexperienced staff driven and perpetuated by underinvestment.
- In the 15-year period from FY 2005 to FY 2020 (the most recent year for which final budget data exist), the state’s vocational rehabilitation agency lost 105 staff positions (including state employees and contractual staff), a decline of 20%.[46] The sharpest drops came during the Great Recession and its aftermath, but rather than rebuild, the state continued to gradually cut staffing as the economy recovered.
Signs of Unmet Need for Correctional Education
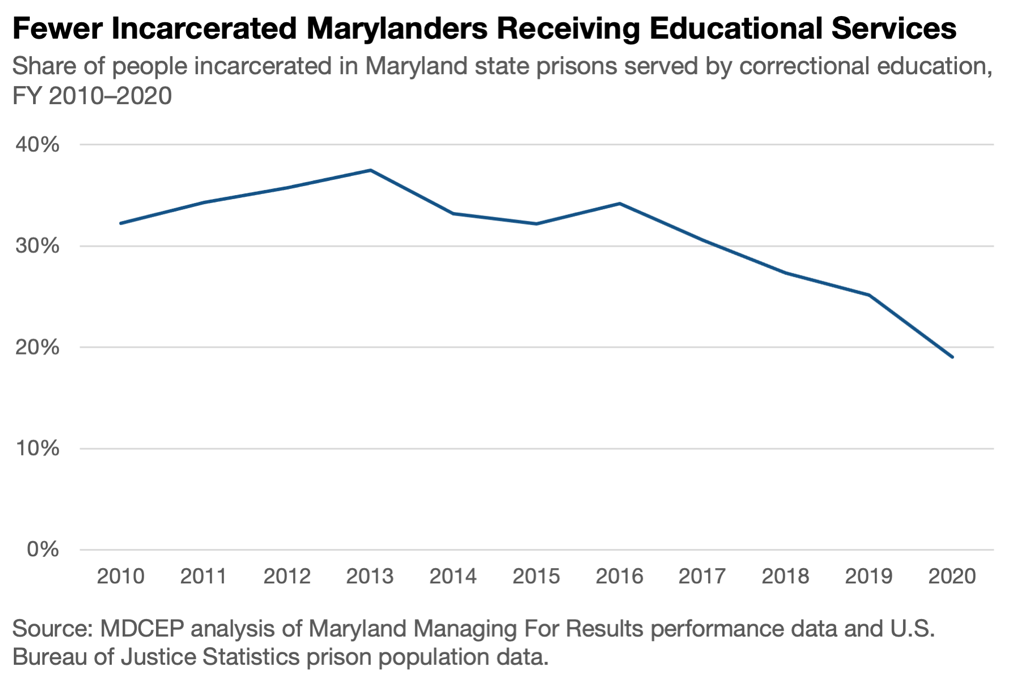
Maryland’s correctional education program serves Marylanders incarcerated in state prisons, offering basic education such as high school diplomas as well as occupational certificates. While Maryland has made progress in reducing our incarcerated population in recent years, the number receiving educational services has fallen even faster:[47]
- The program served 3,544 incarcerated students in the 2019–2020 budget year, or 19% of Marylanders incarcerated in state prisons. Between fiscal years 2015 and 2017, the program served an average of 32% of Marylanders incarcerated in state prisons.
- The state published the number of incarcerated Marylanders on a wait list for correctional education until fiscal year 2014 (published in the governor’s FY 2016 budget proposal). These data show fluctuation in the number of people waiting for services between about 1,000 and 1,700. However, the state stopped publishing this information beginning with the FY 2017 budget, the second budget released by Gov. Hogan and the first prepared entirely during his administration.
- For several consecutive years, the state’s Managing For Results performance management reports have stated an objective that the number of students achieving various credentials “will increase to meet standards established by the Correctional Education Council” or its predecessor body. However, the Managing For Results report does not specify what these targets are. Targets are also not prominently published on the Correctional Education Council website. While the wording used in the Managing For Results report suggests that the state has fallen short of its targets repeatedly, the omission of the targets themselves prevents the public from drawing informed conclusions from these data.
- Unlike other workforce development programs, the correctional education program does not report post-incarceration employment or earnings outcomes for students. The Department of Public Safety and Correctional Services does publish the share of Marylanders on probation or parole who are employed when their case is closed, with the employment rate declining slightly from 31.8% in fiscal year 2016 to 30.9% in 2020. Tracking students’ employment status and earnings would enable better evaluation of the correctional education program’s success in preparing students to return to the non-institutional workforce.
Scant Data on Unmet Needs Elsewhere in the Workforce Development System
There is very little specific data on unmet needs for other workforce development services. Vocational rehabilitation is the only core WIOA program whose section in the WIOA state plan includes detailed, substantive discussion of unmet need. However, there are indications that increased funding would enable other components of Maryland’s workforce development system to better serve workers, employers, and Maryland communities. In a 2020 letter responding to questions the General Assembly submitted, the Maryland Department of Labor stated that “insufficient funds to serve eligible customers” were a barrier to the success of four separate workforce development services.[48]
Maryland’s workforce development system could serve as a tool to advance equity in our labor market, but only if policymakers make it a priority. Today, data from the six WIOA core programs suggest that our workforce development system does not do enough to open doors to stable, well-paying careers.[49]
Our workforce development system is especially important for women and workers of color:
- In the 2019–2020 program year, the majority of participants in all six WIOA core programs in Maryland were people of color, with Black workers constituting the majority in three out of six programs.
- Women constitute the majority of participants in all WIOA core programs except vocational rehabilitation.
Workforce development participants in Maryland face a wide range of barriers to employment, with substantial variation in the barriers facing participants in different programs:
- Majorities of participants in three out of six WIOA core programs have low income as defined by the U.S. Department of Labor.
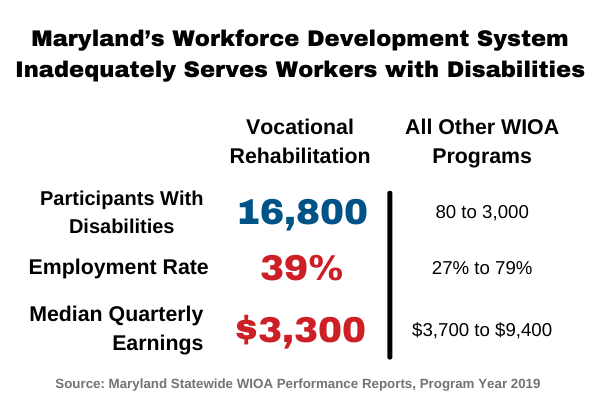
- Vocational rehabilitation participants face the highest barriers overall. Because of the focus of this program, 100% of participants have a disability. In addition, nearly two-thirds have low income and nearly half have been unemployed for more than six months.
- While participants in the Wagner-Peyser employment service are least likely to face the barriers reported in federal data, their absolute numbers are large. For example, about 3,000 Maryland participants in the Wagner-Peyser employment service reported a disability in the 2019–2020 program year – only 5% of Wagner-Peyser participants, but more than the total service populations of the three WIOA Title I programs.
- Unfortunately, WIOA performance data do not report on some practically important barriers, such as access to childcare and reliable transportation.
| Table 6. Characteristics of Workforce Development Participants | ||||||
| Title I | Title II | Title III | Title IV | |||
| Adult | Dislocated Worker | Youth | Adult Education | Employment Service* | Vocational Rehabilitation | |
| Total Participants | 2,631 | 838 | 1,404 | 21,703 | 64,737 | 16,813 |
| Women | 58% | 54% | 55% | 56% | 51% | 44% |
| Men | 40% | 44% | 44% | 44% | 44% | 55% |
| American Indian | 2% | 1% | 2% | 0% | 1% | 1% |
| Asian | 4% | 2% | 1% | 8% | 4% | 3% |
| Black | 52% | 34% | 71% | 32% | 41% | 51% |
| Latinx | 6% | 4% | 7% | 47% | 4% | 4% |
| Native HI/PI | 0% | 0% | 0% | 0% | 0% | 0% |
| White | 31% | 49% | 20% | 12% | 39% | 46% |
| Multiracial | 3% | 2% | 4% | 1% | 2% | 2% |
| Facing Language, Literacy, or Cultural Barriers | 11% | 3% | 64% | 100% | 2% | 32% |
| Previous Criminal Legal System Involvement | 14% | 10% | 9% | 2% | 4% | 11% |
| Experiencing Homelessness | 4% | 3% | 5% | 1% | 2% | 3% |
| Unemployed > 6 Months | 22% | 17% | 7% | 2% | 11% | 48% |
| Low-Income | 71% | 44% | 96% | 2% | 11% | 65% |
| Workers With Disabilities | 15% | 9% | 27% | 3% | 5% | 100% |
| Single Parents | 17% | 9% | 13% | 4% | 2% | 10% |
| Source: Maryland Statewide WIOA Performance Reports, Program Year 2019. | ||||||
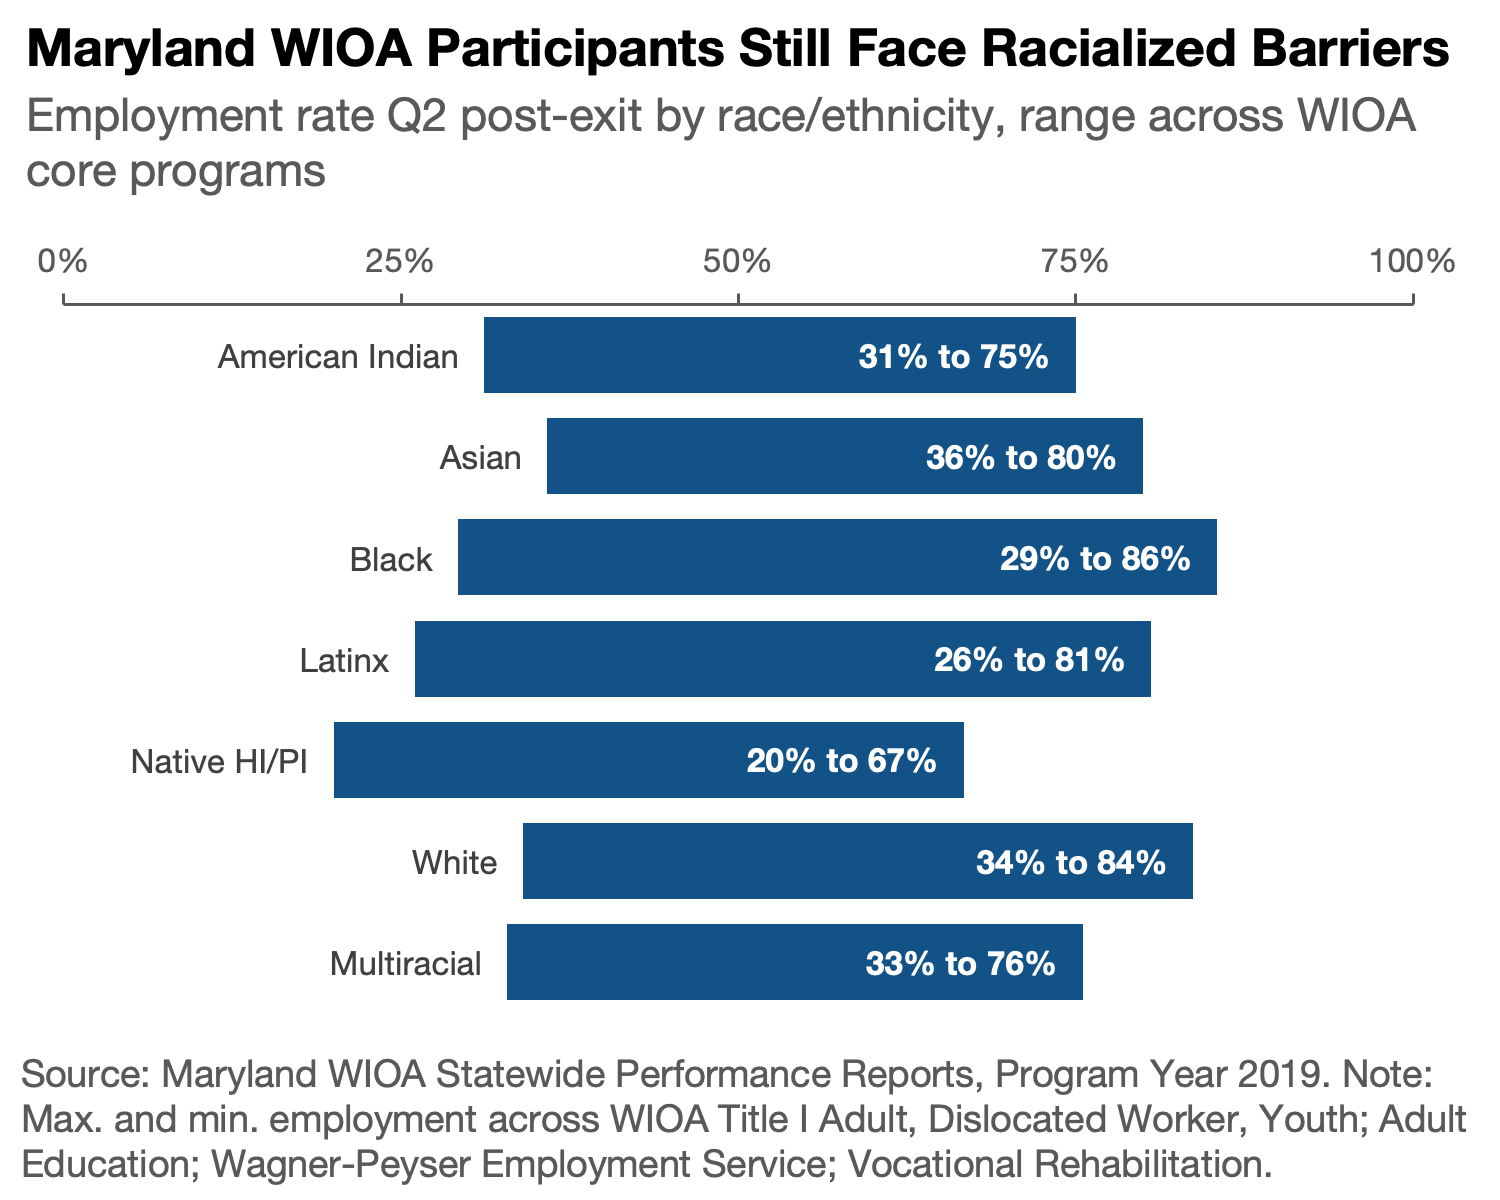
There is considerable variation in the share of participants who are able to get and keep a job after participating in Maryland’s workforce development system, both between programs and between demographic groups:
- Participants in the training-focused WIOA Title I programs are employed at the highest rates two quarters after exiting the programs, including 81% of participants in the adult program and 84% of participants in the dislocated worker program. Three-quarters of those exiting the youth program are employed or engaged in education or training two quarters later.
- The Wagner-Peyser employment service has similar outcomes, with two-thirds of participants employed after two quarters.
- Participants in adult education (33%) and vocational rehabilitation (39%) face the greatest difficulty in getting and keeping a job afterward. This both demonstrates the high barriers participants in these programs face in Maryland’s labor market and suggests that there is room for improvement in connecting these workers to jobs.
- In the second quarter after exit, similar shares of men and women are employed.
- White, Black, and Latinx participants had similar and relatively high employment rates after exit, while members of other racial groups were more likely to have difficulty finding work.
- Workers with disabilities, workers experiencing homelessness, and workers who had previous involvement with the criminal legal system (including but not limited to incarceration) faced the greatest difficulty in finding employment. This both demonstrates the severity of the barriers these workers face and suggests that the state could do a better job in connecting these participants to work.
| Table 7. Employment Status of Workforce Development Participants Two Quarters after Exit | ||||||
| Title I | Title II | Title III | Title IV | |||
| Adult | Dislocated Worker | Youth | Adult Education | Employment Service* | Vocational Rehabilitation | |
| Total: Actual | 81% | 84% | 74% | 33% | 67% | 39% |
| Total: Target | 75% | 80% | 67% | 58% | ||
| Women | 81% | 85% | 77% | 29% | 68% | 39% |
| Men | 80% | 84% | 70% | 39% | 67% | 39% |
| American Indian | 75% | 75% | 54% | 31% | 66% | 36% |
| Asian | 77% | 80% | 55% | 36% | 64% | 37% |
| Black | 81% | 86% | 73% | 29% | 69% | 37% |
| Latinx | 81% | 77% | 71% | 26% | 67% | 40% |
| Native HI/PI | 67% | N/A | 67% | 38% | 66% | 20% |
| White | 81% | 84% | 73% | 34% | 67% | 41% |
| Multiracial | 76% | 64% | 68% | 33% | 67% | 40% |
| Facing Language, Literacy, or Cultural Barriers | 86% | 83% | 75% | 33% | 72% | 40% |
| Previous Criminal Legal System Involvement | 79% | 89% | 65% | 20% | 67% | 31% |
| Experiencing Homelessness | 78% | N/A | 74% | 16% | 59% | 33% |
| Unemployed > 6 Months | 72% | 89% | 88% | 19% | 67% | 34% |
| Low-Income | 79% | 84% | 73% | 30% | 69% | 38% |
| Workers With Disabilities | 68% | 79% | 67% | 27% | 54% | 39% |
| Single Parents | 82% | 80% | 81% | 36% | 76% | 42% |
| Source: Maryland Statewide WIOA Performance Reports, Program Year 2019. | ||||||
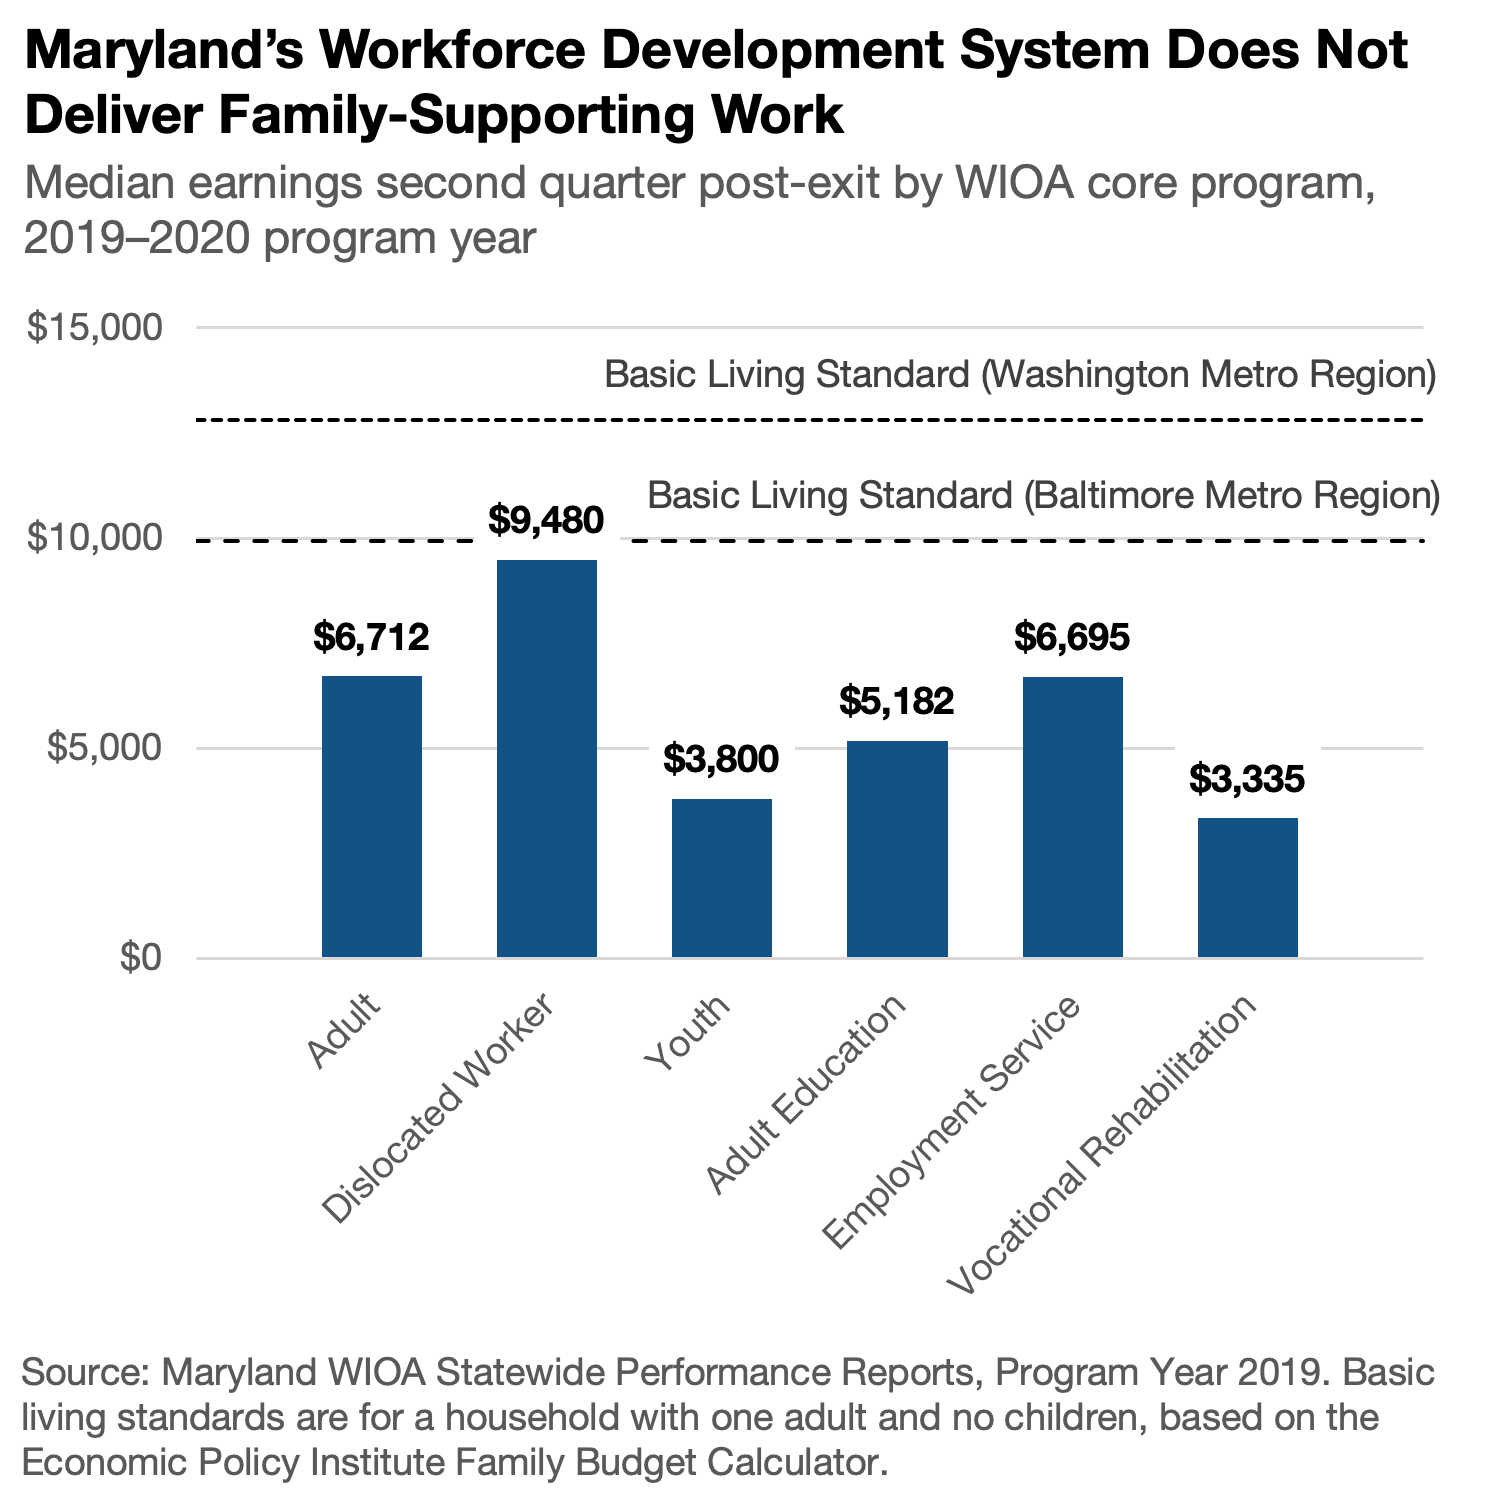
While Maryland’s workforce development system has mixed success in getting participants into jobs, those jobs typically pay meager wages that cannot guarantee a decent living standard for a single worker, let alone a family:
- Among participants who exit and find a job, typical earnings range from about $3,300 per quarter (equivalent to about $13,000 per year) for vocational rehabilitation to about $9,500 per quarter (equivalent to about $38,000 per year) for the Title I dislocated worker program. No program other than the dislocated worker program leads to post-participation median earnings equivalent to more than $30,000 per year.
- According to the Economic Policy Institute, a single adult not caring for children would need to take home about $38,700 per year (equivalent to $9,675 per quarter) to afford a basic living standard in the Baltimore metro area, or about $51,200 per year ($12,800 per quarter) in the Washington metro area. Nowhere in Maryland can a single adult get by on less than $32,250 per year ($8,063 per quarter).[50]
- In the three programs for which the state has set a target for median quarterly earnings, actual outcomes substantially exceed these targets. Given how low participants’ actual earnings are, this indicates that the state is setting deeply inadequate goals.
- For example, in the Wagner-Peyser employment service – the program with the largest service population, whose participants face fewer barriers than in other programs, the state’s target for the 2019–2020 program year was $5,000 per quarter, equivalent to $20,000 per year.
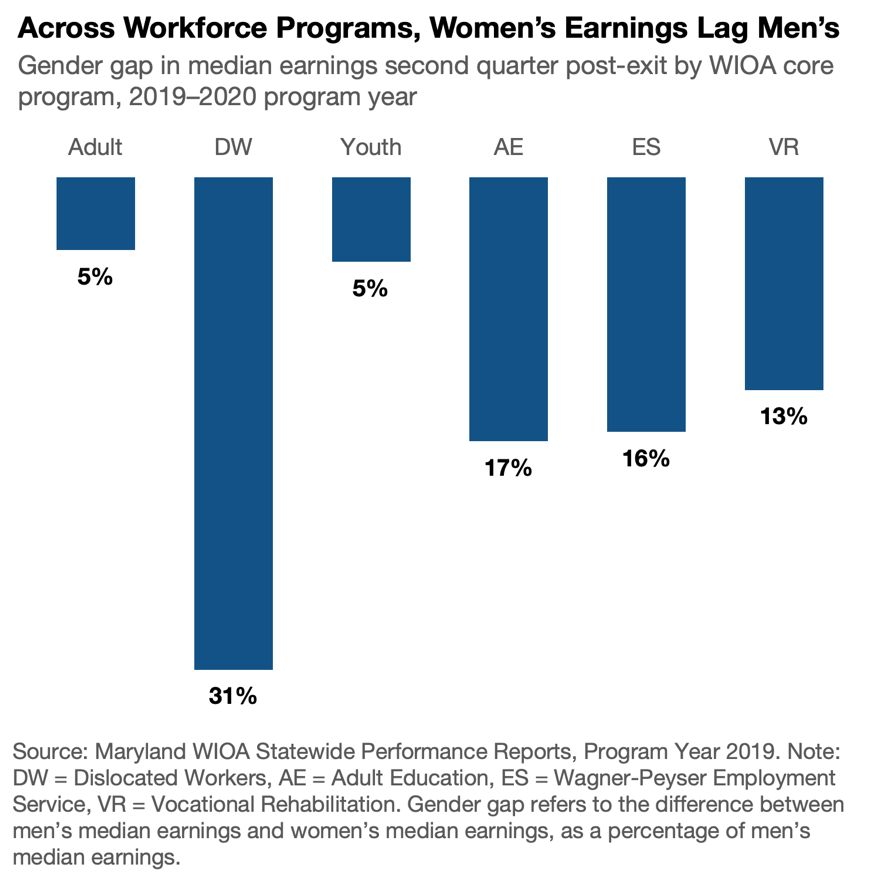
- Although women engage with Maryland’s workforce development system more often than men, they can expect to take home less money afterward. For each $1.00 earned by men in the second quarter after exiting a workforce development program in Maryland, women earn between $0.69 (Title I dislocated worker program) and $0.95 (Title I adult and youth programs).
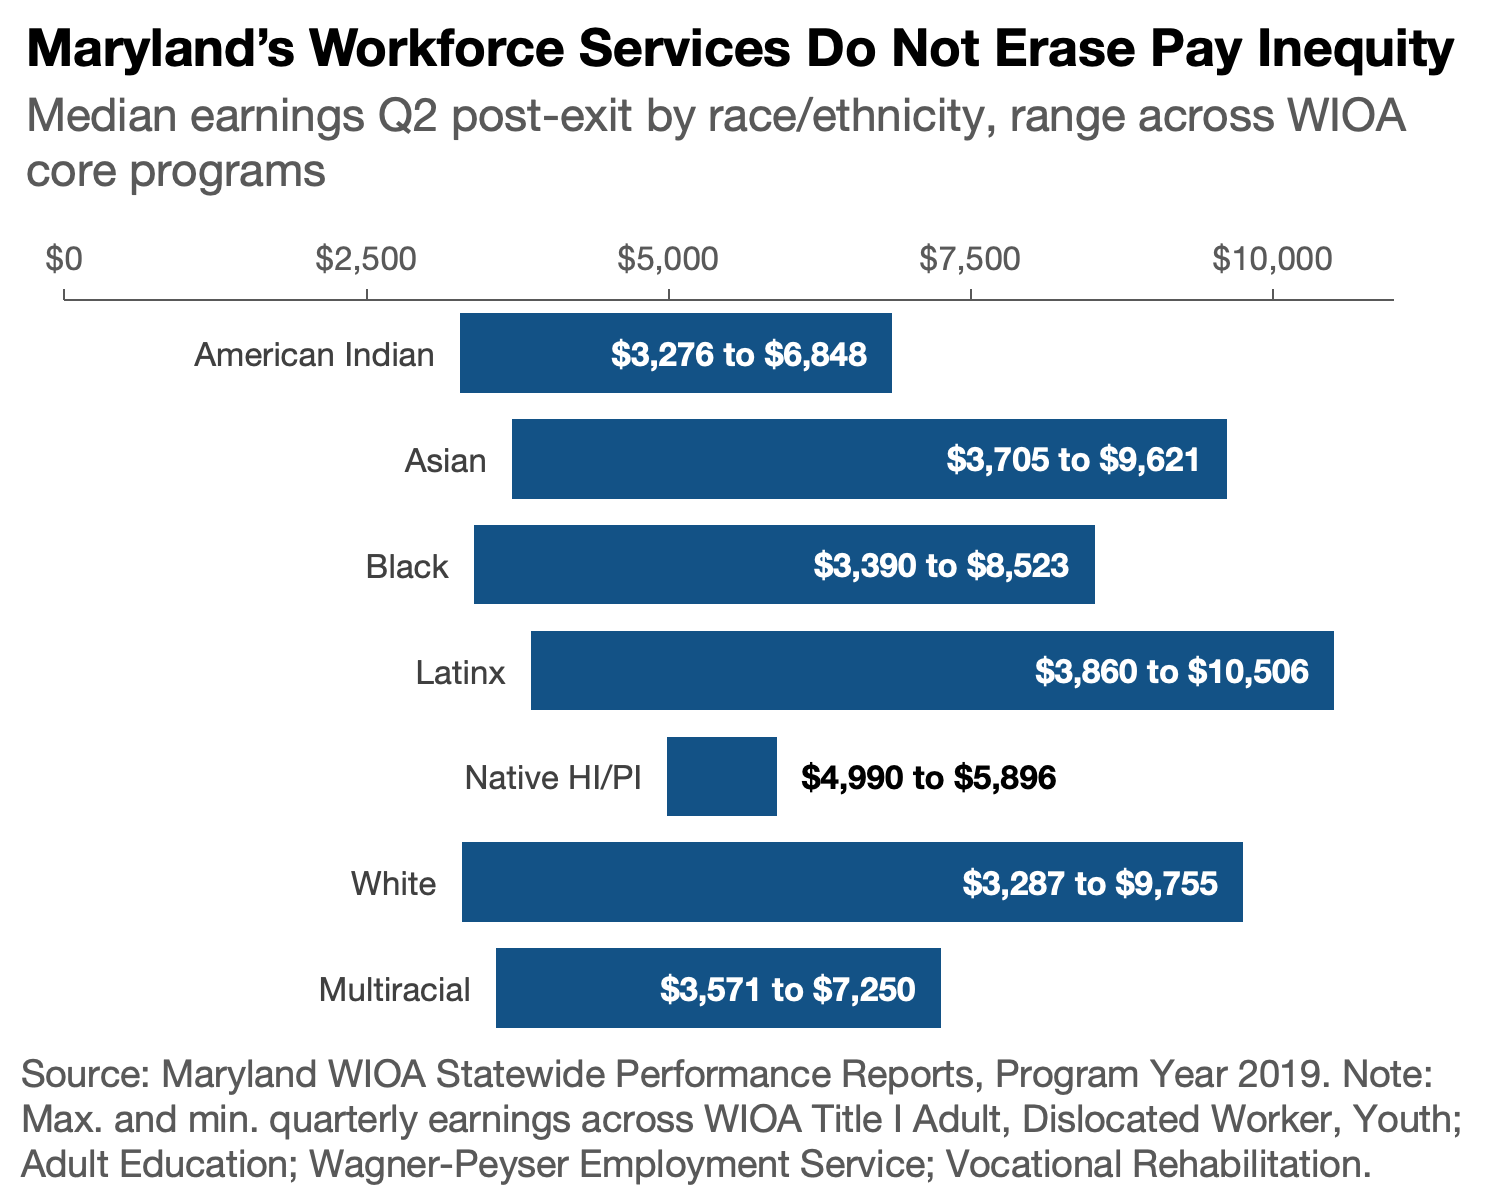
- Typical Black workers take home less than the overall median in four out of six programs, with median quarterly earnings ranging from 12% below the overall median (Wagner-Peyser employment service) to 2% above the overall median (vocational rehabilitation). American Indian participants also generally have lower earnings than other groups, but this is based on only a small number of participants.
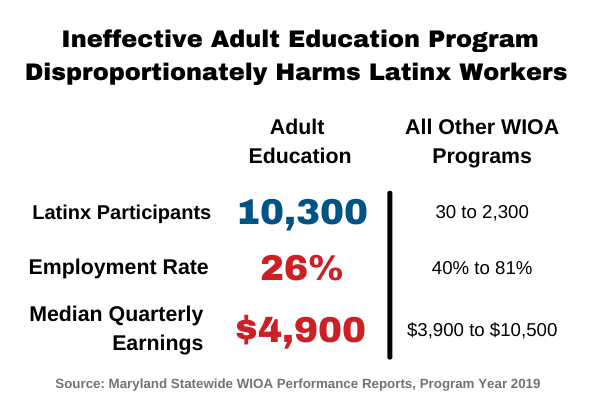
- Asian and Latinx participants generally have earnings above the overall median. However, Latinx participants in adult education – of whom there were 10,000 in the 2019–2020 program year, constituting nearly half the program’s service population – typically take home only $4,900 in the second quarter after exit, less than the overall median and far below the level needed to afford a basic living standard.
- Workers with disabilities and workers with low initial income had the lowest post-exit earnings, while workers experiencing homelessness, workers with previous involvement with the criminal legal system (including but not limited to incarceration), and workers facing language, literacy, or cultural barriers also had comparatively low earnings.
- Because the state reports earnings only on a quarterly basis rather than hourly, it is not clear to what extent low wages as opposed to low hours are responsible for low earnings. This information is essential to determine an appropriate policy response.
Overall, these outcomes show that the state’s workforce development system does not typically open doors to good, family-supporting jobs, and that workers who face discrimination and structural barriers because of their race or other characteristics are most likely to remain locked out of good job opportunities after engaging with the state’s workforce development system. It also suggests that policymakers do not consider current, low earnings for people participating in the state’s workforce development programs to be a problem.
| Table 8. Median Quarterly Earnings of Workforce Development Participants Two Quarters after Exit | ||||||
| Title I | Title II | Title III | Title IV | |||
| Adult | Dislocated Worker | Youth | Adult Education | Employment Service* | Vocational Rehabilitation | |
| Total: Actual | $6,712 | $9,480 | $3,800 | $5,182 | $6,695 | $3,335 |
| Total: Target | $5,900 | $7,900 | $5,000 | |||
| Women | $7,286 | $8,274 | $3,762 | $4,487 | $6,094 | $3,103 |
| Men | $7,634 | $11,989 | $3,973 | $5,381 | $7,257 | $3,582 |
| American Indian | $6,848 | $5,808 | $3,276 | $5,004 | $5,587 | $4,912 |
| Asian | $6,937 | $9,621 | $3,823 | $5,348 | $9,360 | $3,705 |
| Black | $6,430 | $8,523 | $3,815 | $5,000 | $5,902 | $3,390 |
| Latinx | $7,466 | $10,506 | $3,860 | $4,873 | $7,503 | $4,374 |
| Native HI/PI | $5,896 | $5,152 | $4,990 | $5,756 | $5,749 | |
| White | $6,949 | $9,755 | $3,762 | $5,444 | $7,395 | $3,287 |
| Multiracial | $6,760 | $7,250 | $3,571 | $5,279 | $5,984 | $4,410 |
| Facing Language, Literacy, or Cultural Barriers | $6,185 | $5,062 | $3,700 | $5,182 | $4,628 | $3,127 |
| Previous Criminal Legal System Involvement | $6,398 | $7,996 | $3,494 | $3,681 | $4,844 | $4,300 |
| Experiencing Homelessness | $5,284 | $7,209 | $3,838 | $3,248 | $5,151 | $4,143 |
| Unemployed > 6 Months | $6,562 | $9,719 | $4,683 | $4,158 | $5,898 | $2,963 |
| Low-Income | $6,038 | $7,959 | $3,671 | $4,185 | $5,406 | $3,177 |
| Workers With Disabilities | $4,768 | $9,444 | $3,715 | $4,440 | $4,549 | $3,335 |
| Single Parents | $6,218 | $9,431 | $4,236 | $4,085 | $5,846 | $3,412 |
| Source: Maryland Statewide WIOA Performance Reports, Program Year 2019
Note: “Employment Service” refers to services provided under the Wagner-Peyser Act as amended by the Workforce Innovation and Opportunity Act. |
||||||
As discussed in an earlier section, Maryland workers – especially workers of color, women, and workers with disabilities – face a wide array of barriers in the labor market. In many cases, these barriers are the product of inadequate public investment in basics such as education and transportation. Addressing these barriers is essential for three major reasons:
- If the workforce development system helps workers develop skills, earn credentials, and connect with potential employers – but does not remove barriers to employment – it is unlikely to succeed in helping workers achieve stable, family-supporting employment.
- Many of the same factors that lock people out of job opportunities can also stand in the way of accessing workforce development services. This means that workers who face barriers to employment may be unable to access even the services the workforce system does offer, if the system does not also address these issues.
- The ultimate goal of the workforce development system is to foster a healthy labor market in which everyone is able to find a decent job that allows them meet their needs and live with dignity. Many barriers to employment stand in the way of these goals, even if they do not prevent all workers from getting and keeping a job.
Maryland’s WIOA state plan discusses the importance of removing barriers to employment in general terms, but provides little detail on the state’s strategy to do so.[51] In a December 2020 letter responding to questions from the General Assembly, the Maryland Department of Labor discussed barriers such as transportation access, technology access (especially during the COVID-19 pandemic), previous involvement with the criminal legal system, homelessness, and legal requirements barring out-of-school youth and some immigrant workers from receiving services.[52]
The state publishes only limited data on efforts to address barriers to employment. The state’s annual performance report to the federal government includes data on the number of exiting WIOA Title I participants receiving “supportive services,” a broad category that could include services to address the barriers discussed above or others:
- In all three WIOA Title I programs (adult, dislocated worker, youth), the majority of exiting participants are reported as not receiving supportive services. One in five participants in the adult program, one in six in the dislocated worker program, and one-third in the youth program receive supportive services.
- The share of workers receiving supportive services in each program varies substantially by gender, race and ethnicity, and disability status. However, there is no consistent pattern in these differences across programs.
- Single parents and participants with previous involvement with the criminal legal system are more likely than other participants to receive supportive services.
- Participants experiencing homelessness and those who were unemployed for more than six months are slightly less likely than other participants to receive supportive services.
- Participants with low initial income are about as likely as other participants to receive supportive services.
The performance report does not include data on what kinds of supportive services participants received, or on how many participants might need supportive services, regardless of whether they received any. These omissions make it difficult to draw clear conclusions from the data, but the Maryland Department of Labor letter suggests that unaddressed barriers are interfering with many participants’ success.
| Table 9. Percent of Exiting WIOA Title I Participants Who Received Supportive Services, 2019–2020 Program Year | |||
| Adult | Dislocated Workers | Youth | |
| Total | 20.0% | 15.4% | 31.1% |
| Latinx | 23.1% | 13.0% | 40.4% |
| Not Latinx | 20.0% | 15.9% | 30.5% |
| White | 20.1% | 11.1% | 28.7% |
| Black | 19.9% | 20.7% | 32.2% |
| All Others | 16.8% | 8.7% | 36.4% |
| Women | 19.9% | 15.2% | 35.8% |
| Men | 20.5% | 16.2% | 26.6% |
| Workers with Disabilities | 16.3% | 25.7% | 36.7% |
| Unemployed > 6 months | 18.1% | 13.1% | |
| Low Income | 19.3% | 16.7% | 31.3% |
| “Basic Skills/English Deficient” | 30.9% | 12.5% | 33.0% |
| Previous Criminal Legal System Involvement | 27.4% | 26.3% | 33.3% |
| Experiencing Homelessness | 12.8% | 27.3% | |
| Single Parents | 27.8% | 23.2% | 52.9% |
While job training programs are often the main focus of workforce development, other state agencies have significant influence on the challenges and opportunities Maryland workers face as well. The Maryland legislature has passed a number of laws protecting workers – from raising the minimum wage and requiring paid sick days to taking steps to combat pay discrimination through equal pay laws – but those laws are only meaningful if they are enforced.
Further, an effective unemployment insurance system is a critical component of our labor market, as it helps workers who are laid off stay afloat as they search for a new job. The sharp rise in unemployment as a result of the COVID-19 pandemic highlighted significant problems in Maryland’s unemployment insurance system and the agency that oversees the program. Now is the time to address those concerns.
Enforcement of Worker Protections
State investments in labor law enforcement are essential for an equitable labor market. Three state agencies share the bulk of responsibility for enforcing labor standards:
- The Maryland Commission on Civil Rights enforces anti-discrimination law in employment as well as other areas such as housing.
- The Employment Standards Service, which enforces the state minimum wage and other worker protections.
- The Maryland Occupational Safety and Health Administration, which enforces state and federal workplace safety standards.
Without energetic enforcement, state laws governing labor standards and prohibiting discriminatory policies provide little meaningful protection:
- Employers pervasively discriminate against workers of color in hiring decisions, according to two recent comprehensive literature reviews. In fact, research shows that discrimination against Black job applicants has not declined at all over the last 25 years, while discrimination against Latinx applicants may have modestly declined.[53]
- Black applicants are less than half as likely to get a call-back as otherwise-similar white applicants, and in fact Black applicants without a prior criminal conviction are no more likely to get a call-back than white applicants with a conviction.
- Nationwide, wage theft – including minimum wage violations, overtime violations, off-the-clock work, and other forms of illegal underpayment – rivals or exceeds the value of all other forms of theft, according to multiple credible estimates. While limited data on wage theft exist (partly because of inadequate enforcement), a 2017 analysis found that minimum wage violations alone add up to about $15 billion per year nationwide, more than the sum of robberies, burglaries, larcenies, and motor vehicle thefts.[54]
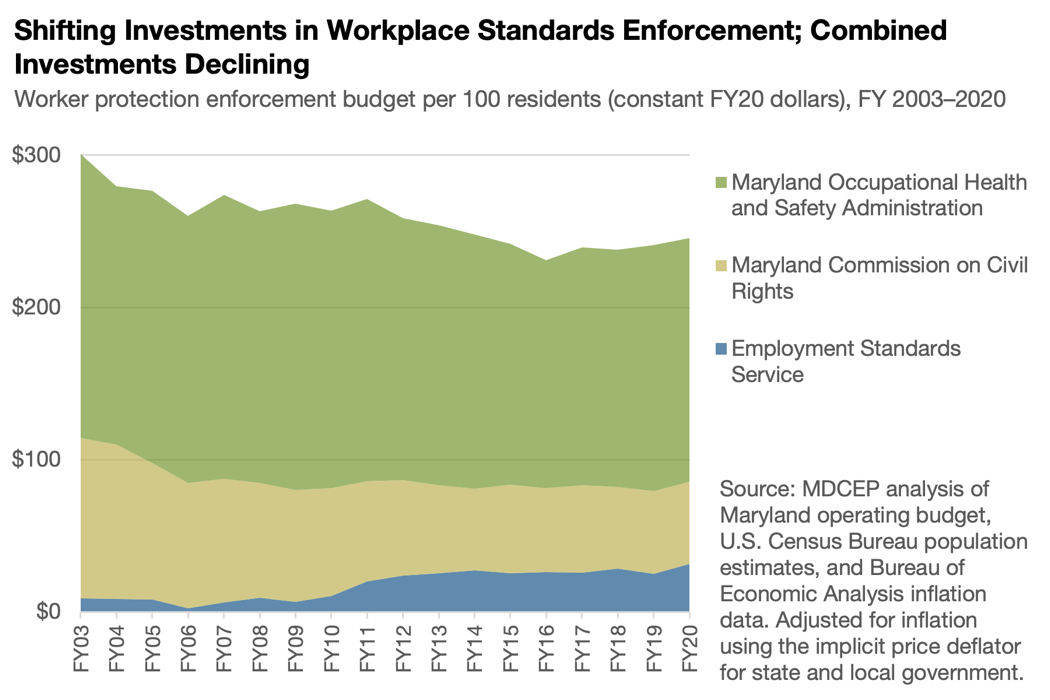
Since the turn of the century, our investments in two out of three worker protection agencies have declined, as has our total investment:
- Both funding (adjusted for inflation and population growth) and staffing at the Maryland Commission on Civil Rights have fallen steadily since the early 2000s.[55] These declines are partly, but not entirely, driven by federal funding trends. However, the state’s hands are not tied – to protect workers of color, women, and workers with disabilities from unlawful discrimination, the state should increase its own investment in the commission to ensure adequate staffing.
- Funding and staffing at the Employment Standards Service have generally increased since fiscal year 2007, when the General Assembly mandated funding in response to an attempt by Gov. Robert Ehrlich to dismantle the agency. These increases have accompanied growth in the agency’s responsibilities as the state has implemented a higher minimum wage and other worker protections.
- Funding for the Maryland Occupational Safety and Health Administration fell by 14% from FY 2003 to FY 2020, driven largely by declining federal investment.
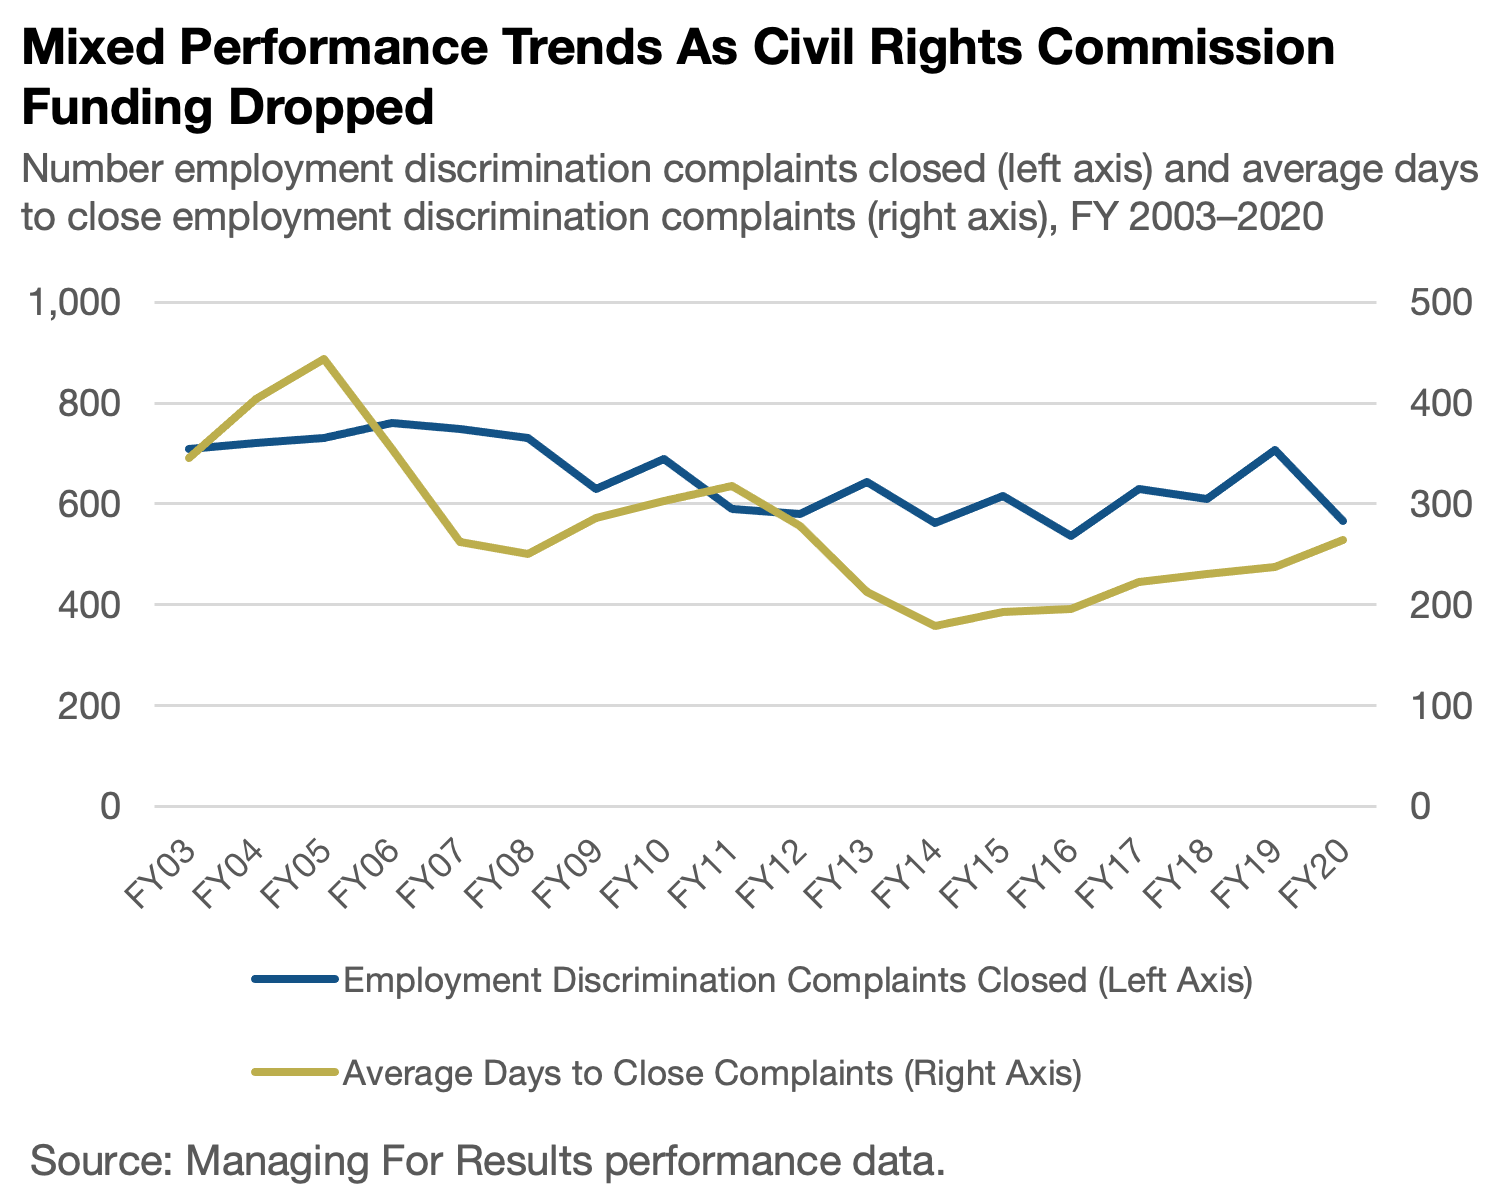
Mixed trends in performance measures at the Maryland Commission on Civil Rights may indicate reduced effectiveness due to staffing cuts:[56]
- The number of employment discrimination complaints closed per year has declined somewhat since the early 2000s, potentially indicating reduced capacity owing to staffing cuts.
- The commission made considerable, though uneven, progress in reducing the time between when an employment discrimination complaint is filed and when the matter is closed. However, that progress has recently reversed. The state briefly brought the average time to close a complaint under 200 days, but that number has steadily increased since FY 2015, recently topping 250 days. This means that on average, a worker who has faced discrimination will have to wait eight months to obtain redress.
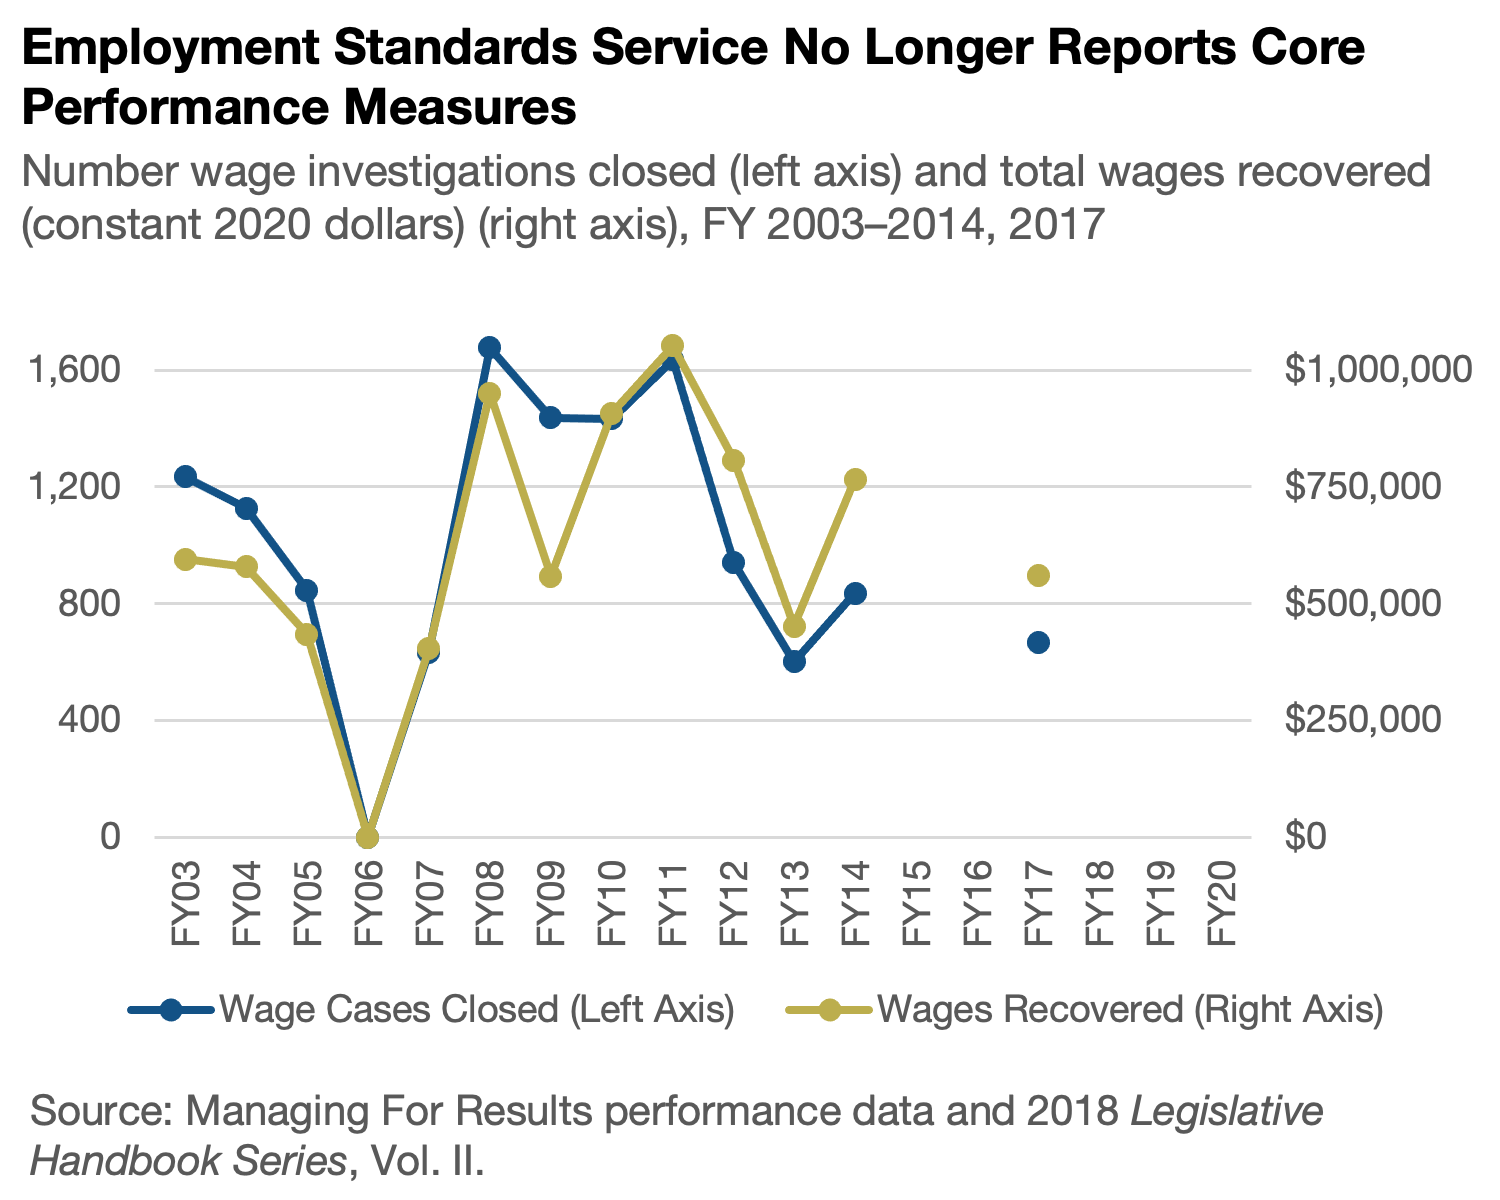
The state’s published performance data make it difficult to assess the performance of the Employment Standards Service. The state regularly published the number of unpaid wage cases handled and the amount of wages recovered through FY 2014 (included with the governor’s FY 2016 budget proposal). This information is no longer included in Managing For Results performance data, beginning with the FY 2017 budget, the second released by Gov. Hogan and the first prepared entirely during his administration. This makes it impossible to determine how effectively the state is working to counter the staggering scale of wage theft perpetrated on low-wage workers.
In particular, state analysts noted that the agency’s productivity took several years to recover after Gov. Ehrlich’s attempt to shut it down, owing to the need to quickly ramp up staffing and restart disrupted processes.[57]
Performance data at the Maryland Occupational Safety and Health Administration also suggest that funding cuts have reduced the agency’s effectiveness. Between fiscal years 2018 and 2020, the agency took an average of 5.3 days to initiate inspections after receiving a complaint, up from an average of 3.1 days between fiscal years 2013 and 2015. This slide in timeliness coincided with a large drop in the number of complaints received, suggesting that the agency struggled to handle even a reduced caseload.
Unemployment Insurance
Maryland’s unemployment insurance system is failing out-of-work Marylanders in multiple ways. Far too many people are excluded from receiving benefits, and those who are eligible can face long wait times and administrative barriers, only to receive payments that are insufficient to keep them afloat during a challenging time.
The coronavirus pandemic exposed severe administrative problems in Maryland’s unemployment insurance system, forcing thousands of workers to wait months to receive badly needed benefits to which they were legally entitled.
- Only 22% of unemployed workers in Maryland received payments within three weeks of applying, as of October 2021, a fraction of the federal government’s 87% standard.[58] This made Maryland the third-worst state nationwide for timely payments.
- Many Marylanders used social media to share stories and tips regarding their experiences with the state’s unemployment system. One Facebook group included nearly 28,000 members, who discussed issues such as hours spent on hold on the Division of Unemployment Insurance help line, only to be disconnected before speaking to anyone. Journalists confirmed this pattern in a weeklong series of test calls in early 2021.[59]
- The General Assembly passed legislation providing funding to upgrade the state’s unemployment administrative system. However, as of late August 2021, a bipartisan letter from the full Maryland congressional delegation reported that about half of applicants were still waiting more than three weeks to receive payment.[60] Maryland was also lagging other states in resolving eligibility issues, including states with eligibility rules similar to ours.
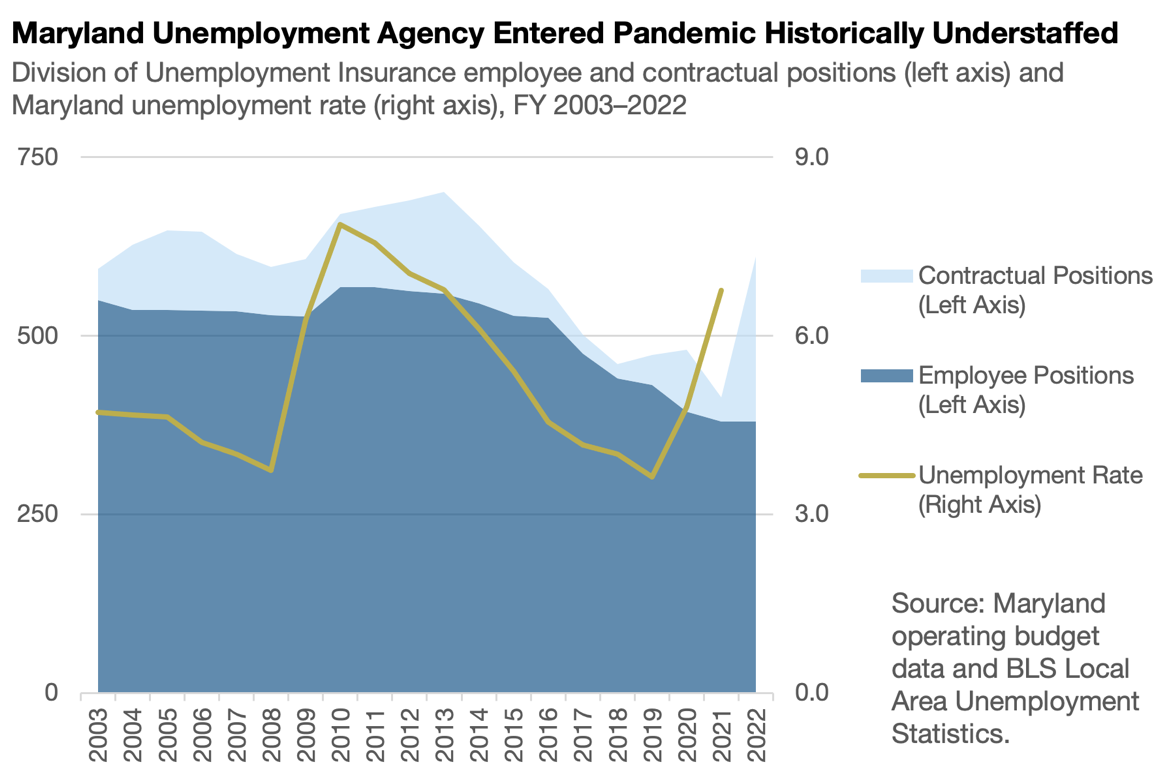
- Maryland Labor Secretary Tiffany Robinson in February 2021 pointed to inadequate staffing – a direct result of budgetary choices – as one reason for these administrative problems.[61] In the three budget years before the pandemic (FY 2017–2019), the Division of Unemployment Insurance had an average of 478 authorized positions, including state employees and contractual positions. In the years leading up to the Great Recession (FY 2006–2008), the division had 619 authorized positions. The state’s average unemployment rate during these two periods was nearly identical (4.0% in FY 2006–2008 versus 3.9% in FY 2017–2019).[62]
Maryland’s meager level of unemployment benefits provides only minimal security to unemployed workers:
- In 2019, unemployment benefits averaged $357 per week, equivalent to $18,553 per year.[63] This is far below the amount needed to maintain a basic living standard anywhere in Maryland.
- Even with the expanded benefits federal pandemic relief legislation provided, Marylanders who use unemployment benefits to make ends meet still faced considerable hardship during summer 2021. Nearly half reported having difficulty paying for usual household expenses; one in five said they didn’t always get enough to eat; one in nine were behind on their most recent mortgage or rent payment; and one-third weren’t sure they can make their next housing payment.[64]
- After the expiration of federal enhanced benefits on Labor Day 2021, benefits are now back to their deeply inadequate pre-pandemic level.
Because of archaic eligibility rules, the vast majority of unemployed workers in Maryland aren’t eligible for any unemployment benefits:
- Before the coronavirus pandemic hit, only 23.5% of unemployed workers in Maryland received unemployment benefits, a smaller share than in 28 other states.[65] Unemployed workers in all four of Maryland’s neighboring states were more likely to receive unemployment benefits. In New Jersey, 59.0% of unemployed workers received benefits.
- Federal pandemic relief legislation created several supplemental programs to cover workers left out by traditional unemployment insurance, such as app-based workers, self-employed workers, and long-term unemployed workers. The vast majority of Marylanders receiving unemployment benefits in summer 2021 were covered by these supplemental programs.[66] With the expiration of these programs on Labor Day 2021, these workers are now left without any assistance.
Invest in Foundations of Thriving Communities
Many of the barriers standing between Marylanders of color and good job opportunities or decent wages are the result of choices to underinvest in basic public services. Increasing these investments would improve job opportunities and strengthen communities in multiple other ways:
- Housing: The state should step up investment in safe, lead-free housing at affordable prices, spread geographically so as to meaningfully integrate Maryland neighborhoods and maximize transit access. We should use state funds to expand rental assistance to the thousands of families who are eligible but do not receive any help because of inadequate federal funding. We should fully fund the newly created program to ensure renters have legal representation when landlords try to expel them from their homes.
- Education: The governor and legislature should continue to fully fund the recently passed Blueprint for Maryland’s Future, a historic investment in Maryland public schools. Policymakers should plan in advance for potential economic downturns to avoid backsliding as we did during the Great Recession. The state should also strengthen support for higher education (including community colleges and four-year institutions) to prevent continued, unaffordable growth in tuition and fees.
- Health: The COVID-19 pandemic has demonstrated how essential a healthy population is for a healthy labor market. We should use state funds to ensure every Marylander has health insurance, beginning with Marylanders born outside the United States, who in many cases are excluded from Medicaid and other federal health care programs. We should also rebuild support for local health departments, which have been hollowed out over the last 30 years, and pay competitive rates to the providers who care for clients who have health coverage through Medicaid.
- Transportation: State policymakers should make robust investments in reliable, high-frequency public transit to increase the number of jobs accessible to workers who do not own a car. These investments should include maintenance and modernization, increasing capacity on existing routes, and building new routes. Expanding affordable housing in areas with existing transit would also advance this goal.
- Childcare: The state should conduct outreach to maximize public awareness of childcare assistance, increase provider rates to the full 75th percentile federal standard, and if necessary use state funds to prevent future wait lists or eligibility restrictions. The state should also establish a payroll-supported social insurance fund to guarantee all workers access to paid family and medical leave.
- Consumer demand: The number and quality of jobs available is determined in large part by families’ ability to spend money in the local economy. Strong public services, supported by fair taxes on wealthy individuals and profitable corporations, support consumer demand by shifting money into the hands of working families who will cycle it back into the local economy.
Strengthen Worker Protections
- Invest in enforcement: The state should provide increased funding and staffing to the Maryland Commission on Civil Rights, Employment Standards Service, and Maryland Occupational Safety and Health Administration. Sufficient staffing will enable these agencies to investigate and resolve complaints quickly and reliably.
- Use innovative enforcement strategies: The state could provide greater protection to workers through approaches like proactive monitoring of employers and industries with high rates of violating labor laws, outreach to increase awareness of worker protections and confidence in meaningful enforcement, and partnerships between enforcement agencies and worker advocates.
- Expand protections: The state should fill in gaps in its worker protection system by prohibiting unnecessary inquiries into job applicants’ involvement with the criminal legal system, prohibiting retaliation in all workforce standards cases, requiring employers to provide reasonable accommodations to workers with disabilities, guaranteeing paid family and medical leave, and expanding collective bargaining rights to workers left out of federal collective bargaining law.
Reform Unemployment Insurance
- Fix administrative problems: Understaffing and outdated technology hampered the state in getting help to workers who needed it during the COVID-19 pandemic, leaving thousands of workers to wait weeks or months to receive payments they were owed, as bills piled up. The General Assembly in 2021 passed legislation intended to address these failures. State leaders must implement this legislation faithfully, ensure unemployment administration is funded adequately, and resist the temptation to cut back as the current crisis recedes from memory.
- Modernize eligibility rules: Most Maryland workers receiving unemployment benefits were cut off when federal emergency unemployment programs expired on Labor Day 2021. The basic unemployment insurance program’s eligibility rules simply do not reflect today’s economy. We should expand eligibility to include app-based workers, self-employed workers, and those with irregular employment history or low earnings.
- Strengthen benefits: Maryland’s current unemployment benefits are far too low to support a basic standard of living. This problem was less urgent while federal emergency benefit expansions were in place, but those programs have now expired. The state can accomplish this by increasing the cap on weekly unemployment benefits as well as the replacement rate used to calculate benefits. The state could aim to increase the average weekly benefit from its current, deeply inadequate level ($357), to a level that can support a basic living standard at least for a single worker without children. In the Baltimore metropolitan area, this requires an income of $744 per week, according to the Economic Policy Institute.
Invest in Workforce Development
- Take on unmet need: Thousands of Maryland workers want and are eligible for workforce development services but do not receive any because of inadequate funding. This problem is most severe for vocational rehabilitation services to workers with disabilities, but there is evidence that the state currently underinvests in WIOA Title I programs and correctional education as well. While insufficient federal funding is an important factor for these service gaps, the state’s hands are not tied. We should invest enough to ensure that everyone who wants and is eligible for services can receive them.
- Invest in community colleges: Community colleges are an essential component of both our workforce development system and our system of public higher education. Students of color are a larger share of the student body at community colleges than at four-year institutions, and community colleges fill an important business need for skills not taught in high school but not requiring a four-year degree. The state should strengthen its investments in community colleges and ensure that students are not locked out by unaffordable tuition, fees, living expenses, or administrative hurdles. As a first step, lawmakers should require sufficient funding of Promise Scholarships to ensure no eligible student pays community college tuition out of pocket.
- Dismantle barriers to employment: The state reports that workers receiving workforce development services face an array of barriers to employment, but most participants do not receive supportive services through these programs. Policymakers should ramp up efforts to identify workers’ barriers to employment (such as transportation, childcare, or others) and invest in services to dismantle these barriers. At the same time, policymakers must strengthen broader investments in the foundations of thriving communities, so that workers will not face these barriers in the first place.
- Focus on marketable skills: Workers benefit most when occupational training focuses on marketable skills that can open up a range of job options and lay the groundwork for career advancement. While businesses benefit from highly customized training services, it is essential to ensure that workers gain a skill set that does not tie them to a specific employer.
- Our hands are not tied: State publications that discuss unmet need for workforce development services often focus on inadequate federal funding. This is a real problem that Congress should address. At the same time, nothing prevents the state from investing more in workforce development than is required by federal funding formulas. The state should use its own resources as necessary to clear wait lists and get workers the help they need.
Insist on Good Jobs
- Set decent earnings targets: The state’s current earnings targets for workers exiting workforce development programs are deeply inadequate, in most cases falling short of the level required for even a single adult without children to maintain a basic living standard anywhere in Maryland. Actual results generally exceed these targets – suggesting that higher targets would be realistic – but are still out of step with the cost of living in Maryland. The state should set substantially higher standards and develop concrete plans to achieve these more ambitious goals. The state could set a minimum quarterly earnings target of $9,675, based on cost-of-living estimates for the Baltimore metropolitan area.
- Incorporate wage standards in business partnerships: Businesses that partner with the workforce development system to build their talent pipeline are receiving a valuable service from the state. The state should require that partner employers reciprocate by paying a family-supporting wage to all workers. We should also set standards for health benefits, paid leave, and safe working conditions.
- Ensure accountability: Workforce development agencies should actively work with employment standards agencies to ensure that partner employers do not violate the rights of workers participating in workforce development programs. The state should exclude from partnerships any employer with an excessive history of labor law violations (whether or not those violations involve workforce development participants), with the possibility of reinstatement if the employer takes meaningful corrective action.
- Fight credential inflation: Research shows that employers increase required qualifications listed in job advertisements when unemployment is high, even when there is no change in job duties or necessary skills.[67] This arbitrarily excludes qualified workers, and once the economy improves, can leave employers struggling to fill positions despite a qualified and willing workforce. The state should require that partner employers match qualifications in job advertisements to the skills required for actual job duties.
- Support worker voices: Workers have more power to demand decent wages and working conditions when they join together and negotiate as a group. The state should prohibit its partner employers from hiring so-called union avoidance consultants, holding captive audience meetings, or violating federal collective bargaining law. The state can also protect fiscal investments in workforce development by requiring labor peace agreements and project labor agreements. These agreements should include fair hiring provisions to prevent inequitable barriers to entry.
Invest in Data
An effective, equitable workforce development system requires high-quality data to monitor performance and track outcomes. While federal workforce development funding comes with valuable reporting requirements, there is significant room for improvement:
- Track hourly wages: Federal performance data currently focus on the total quarterly earnings of workers who exit workforce development services. This is valuable information, but provides little insight on the reason for low earnings: Are workers taking home low hourly wages, are they unable to secure enough working hours, or do they work low hours for another reason? Tracking hourly wages would enable policymakers effectively focus efforts to increase earnings.
- Track unmet need: Partly because of stricter federal rules, the Division of Rehabilitation Services conducts relatively robust assessment of unmet need for its services. Other workforce development agencies are much less transparent, though there is evidence suggesting they could serve more workers with additional funding. Every workforce development service should publish the number of people served, the number of any wait lists and, if possible, an estimate of the total number who are eligible for services but not receiving them. Agencies should also publish analysis of what specific factors prevent them from serving more workers.
- Track employment barriers and supportive services: While the state includes limited information on supportive services in federal performance reports, this does not include details on what services participants are receiving or any assessment of participants’ needs for supportive services. This knowledge gap is particularly concerning because most workforce development participants do not receive any supportive services.
- Track worker-relevant outcomes for all services: While performance monitoring for WIOA core services appropriately centers participants’ subsequent employment status and earnings, no such data are available for some other programs, such as correctional education. Tracking employment and earnings would help ensure that correctional education benefits participants and sets them up for stability post-release. Additional outcomes such as food security, housing cost burden, and measures of mental health would provide deeper insights into how well our workforce development system serves Maryland workers.
- Set realistic but desirable performance targets: As discussed above, the state’s quarterly earnings targets for workforce development participants are inadequate to support a basic living standard. This means that it is the state’s official policy that low wages and material hardship are acceptable. While performance targets should be realistically achievable, they should also be high enough to represent actually desirable outcomes.
- Ensure data equity: Disaggregating data on needs, services, and outcomes by race and ethnicity, gender, disability, and other equity-relevant characteristics is essential to ensure that workforce development services are being delivered equitably. The state performs relatively well on this front, partly because federal rules require significant data disaggregation. The state should ensure that all additional performance measures are disaggregated, whether or not this is required by federal law.
- Our hands are not tied: The data recommendations made here exceed those required by federal law. However, federal law sets a floor, not a ceiling on performance measurement. When necessary, the state should use its own resources to fund robust, informative data reporting.
- Practice data transparency: Policymakers and agency staff likely already have some data on the knowledge gaps discussed here. However, well-informed, democratically accountable policymaking requires that relevant performance data (as well as applicable targets) be readily available to the public whenever possible. This means not only that data should be published, but that they should be in prominent locations on agency websites and updated regularly. Furthermore, Managing For Results performance data published with the state budget each year should center the outcomes that matter for Maryland workers, such as hourly wages and indicators of economic hardship. The state should, of course, apply prudent safeguards to protect workers’ privacy.
[1]In Vol. 2 of the 2018 Legislative Handbook Series, the Department of Legislative Services lists $300 million in workforce development expenditures in FY 2017 (Exhibit 14.4).
http://dls.maryland.gov/pubs/prod/RecurRpt/Handbook_Volume_2_Government_Services.pdf
The Department of Budget and Management reported workforce development expenditures in Appendix R of Budget Highlights for fiscal years 2010 to 2020. Appendix R defined workforce development to include a wider range of investments such as childcare subsidies and public colleges and universities. By this definition, the state invested $6.6 billion in workforce development in FY 2017.
[2] Stuart Andreason and Alexander Ruder, “Investing in Systems for Employment Opportunity,” in Investing in America’s Workforce: Improving Outcomes for Workers and Employers, ed. Stuart Andreason, Todd Greene, Heath Prince, and Carl E. Van Horn (Atlanta, GA: Federal Reserve Bank of Atlanta, 2018), https://www.investinwork.org/-/media/68AAA0BA542445508B3CAE88EAFC233D.ashx
[3] Legislative Handbook Series Vol. 3: Government Services in Maryland, Department of Legislative Services, 2019, http://dls.maryland.gov/pubs/prod/RecurRpt/Handbook_Volume_2_Government_Services.pdf
[4] For detailed discussion of WIOA’s structure and provisions, see David Bradley, “The Workforce Innovation and Opportunity Act and the One-Stop Delivery System,” Congressional Research Service, 2021, https://www.everycrsreport.com/reports/R44252.html
This report also includes detailed descriptions of services provided under WIOA Title I and an overview of services provided under Title III.
[5] See “Adult Education and the Family Literacy Act: Major Statutory Provisions,” Congressional Research Service, 2014, https://www.everycrsreport.com/reports/R43789.html
[6] CRS and maybe also Upjohn
https://www.everycrsreport.com/reports/R44252.html
For an overview of WIOA Title III services, see Bradley, 2021.
For detailed discussion of the Wagner-Peyser Act Employment Service as amended by the Workforce Investment Act of 1998, see Christopher O’Leary and Randall Eberts, “The Wagner-Peyser Act and U.S. Employment Service: Seventy-Five Years of Matching Job Seekers and Employers,” W.E. Upjohn Institute for Employment Research, 2008, https://research.upjohn.org/cgi/viewcontent.cgi?article=1032&context=reports
[7] See “Rehabilitation Act: Vocational Rehabilitation State Grants,” Congressional Research Service, 2014, https://www.everycrsreport.com/reports/R43855.html
[8] “Skills Mismatch: Lack of Access to Skills Training Hurts Workers and Businesses,” National Skills Coalition, 2020, https://www.nationalskillscoalition.org/skills-mismatch/
[9] Lawrence Mishel and Josh Bivens, “Identifying the Policy Levers Generating Wage Suppression and Wage Inequality,” Economic Policy Institute, 2021, https://www.epi.org/unequalpower/publications/wage-suppression-inequality/
[10] Kyle Moore, “Economic Indicators: State Unemployment by Race and Ethnicity,” Economic Policy Institute, 2021, https://www.epi.org/indicators/state-unemployment-race-ethnicity/
[11] Moore, 2021.
[12] Except where otherwise noted, all wage data in this section based on Economic Policy Institute analysis of Current Population Survey Outgoing Rotation Group data.
[13] Economic Policy Institute, State of Working America Data Library, “Wages for Top 1.0%, 0.1%, and Bottom 90%,” 2021, https://www.epi.org/data/#?subject=wagegroup
[14] Meredith Covington and Ana Hernandez Kent, “The ‘She-Cession’ Persists, Especially for Women of Color,” Federal Reserve Bank of St. Louis, 2020, https://www.stlouisfed.org/on-the-economy/2020/december/she-cession-persists-women-of-color
[15] The ratio fell somewhat, to 1.97, in 2020. Because of data availability issues and for the sake of consistency, this discussion focuses on 2019 wages. Additionally, 2020 wage statistics may misleadingly reflect massive, temporary job losses among low-wage workers due to the pandemic.
[16] Elise Gould, “State of Working America Wages 2019: A Story of Slow, Uneven, and Unequal Wage Growth over the Last 40 Years,” Economic Policy Insitute, 2020, https://www.epi.org/publication/swa-wages-2019/#fig-j
See Figure J.
[17] MDCEP analysis of 2015–2015 IPUMS American Community Survey microdata.
[18] “EARN Maryland Annual Report 2020,” Maryland Department of Labor, https://www.dllr.state.md.us/earn/earnannrep2020ac.pdf
[20] Timothy Bartik, “Who Benefits from Economic Development Incentives? How Incentive Effects on Local Incomes and the Income Distribution Vary with Different Assumptions about Incentive Policy and the Local Economy,” W.E. Upjohn Institute, 2018, https://research.upjohn.org/cgi/viewcontent.cgi?referer=&httpsredir=1&article=1037&context=up_technicalreports
[21] Except where otherwise noted, all workforce statistics in this section based on MDCEP analysis of 2015–2015 IPUMS American Community Survey microdata. Sample consists of Maryland adults ages 18 to 64.
[22] Detailed occupation codes were classified as four-year occupations or non-four-year occupations based on the share of employed workers in those occupations nationwide holding a four-year degree, in 2015–2019 IPUMS American Community Survey microdata. For example, librarians (occupation code 2430) are classified as a four-year occupation because more than 50% of librarians hold at least a four-year degree (83%). Library technicians (occupation code 2440) are classified as a non-four-year occupation because less than half of library technicians hold at least a four-year degree (30%).
[23] While these comparisons are based on broad occupational classifications (four-year- v. non-four-year occupations), significant pay disparities remain when controlling for detailed occupation groups along with other worker characteristics.
[24] Respondents were classified as having a disability if they responded yes to one or more subparts of Questions 18, 19, or 20 on the person questionnaire. These questions concern deafness or difficulty hearing, blindness or difficulty seeing, cognitive difficulties, mobility difficulties, and difficulty with daily activities such as dressing, bathing, and doing errands alone. For question text, see https://usa.ipums.org/usa-action/source_documents/enum_form_ACS(2019)_tag.xml#117
[25] MDCEP analysis of 2015–2019 American Community Survey five-year estimates.
[26] For further discussion, see Christopher Meyer, “Budgeting for Opportunity: How Our Fiscal Policy Choices Can Remove Barriers Facing Marylanders of Color and Advance Shared Prosperity,” Maryland Center on Economic Policy, 2018, http://www.mdeconomy.org/budgeting-for-opportunity-health-education-transportation/
[27] Leila Morsy and Richard Rothstein, “Toxic Stress and Children’s Outcomes,” Economic Policy Institute, 2019, https://www.epi.org/publication/toxic-stress-and-childrens-outcomes-african-american-children-growing-up-poor-are-at-greater-risk-of-disrupted-physiological-functioning-and-depressed-academic-achievement/
[28] MDCEP analysis of funding adequacy data from Department of Legislative Services July 24, 2019, presentation to the Blueprint for Maryland’s Future Funding Formula Workgroup (http://dls.maryland.gov/pubs/prod/NoPblTabMtg/CmsnInnovEduc/2019_07-24_AdequacyDLS.pdf) and enrollment data by race and ethnicity from the National Center for Education Statistics.
[29] C. Kirabo Jackson, Rocker Johnson, and Claudia Persico, “The Effects of School Spending on Educational and Economic Outcomes: Evidence from School Finance Reforms,” The Quarterly Journal of Economics 131 no. 1, 2016,
https://academic.oup.com/qje/article-abstract/131/1/157/2461148
[30] Meyer, “Budgeting for Opportunity,” 2018
[31] MDCEP analysis of 2015–2019 IPUMS American Community Survey microdata.
[32] MDCEP analysis of 2015–2019 IPUMS American Community Survey microdata.
[33] Andrew Owen and Brendan Murphy, Access Across America: Transit 2019,” Center for Transportation Studies, 2020, https://access.umn.edu/research/america/transit/2019/documents/AccessAcrossAmerica-Transit2019_sm.pdf
[34] See Christopher Meyer, “‘Back to Normal’? Not Yet: 190,000 Marylanders Still Out of Work,” Maryland Center on Economic Policy, 2021, http://www.mdeconomy.org/back-to-normal-not-yet-190000-marylanders-still-out-of-work/
[35] Nine Chien, “Factsheet: Estimates of Child Care Eligibility & Receipt for Fiscal Year 2018,” U.S. Department of Health and Human Services, 2021, https://aspe.hhs.gov/sites/default/files/2021-08/cy-2018-child-care-subsidy-eligibility.pdf
[36] Karen Schulman, “On the Precipice: State Child Care Assistance Policies 2020,” National Women’s Law Center, 2021, https://nwlc.org/wp-content/uploads/2021/05/NWLC-State-Child-Care-Assistance-Policies-2020.pdf
[37] See Jennifer Botts, Fiscal and Policy Note for SB 181 of 2019, Maryland Department of Legislative Services, 2019, https://mgaleg.maryland.gov/2019RS/fnotes/bil_0001/sb0181.pdf
[38] Schulman, 2021.
[39] Christopher Meyer, “Budgeting for Opportunity: Our Shared Investments Can Build Safe, Just, Thriving Communities,” Maryland Center on Economic Policy, 2020, http://www.mdeconomy.org/budgeting-for-opportunity-justice/
[40] MDCEP analysis of Maryland operating budget data. Detailed actual expenditures for FY 2021 will be published with the governor’s FY 2023 budget proposal this coming January.
[41] MDCEP analysis of Maryland operating budget data, U.S. Census Bureau Population Estimates, and Bureau of Economic Analysis inflation data. Adjusted for inflation using the implicit price deflator for state and local government.
[42] Community college funding based on Department of Legislative Overview of State Aid to Local Government publications. Community college funding includes direct operating aid (including the Cade formula and other funding sources) and the budget for Baltimore City Community College, which is a state agency. Does not include state retirement contributions.
[43] An archived version of the Maryland Division of Rehabilitation Services website captured June 23, 2020 reports “more than 2,931” people on the waiting list. Neither the current website nor more recent archived versions report this information. See “The Waiting List,” Maryland Division of Rehabilitation Services, web archive captured June 23, 2020, https://web.archive.org/web/20200623170532/https://dors.maryland.gov/consumers/Pages/waiting.aspx
[44] “2020–2024 WIOA State Plan,” Maryland Department of Labor, https://www.dllr.state.md.us/wdplan/wdstateplan.pdf
[45] Maryland 2020–2024 WIOA State Plan.
[46] MDCEP analysis of Maryland historical operating budget data.
[47] MDCEP analysis of Managing For Results performance data and Bureau of Justice Statistics data on people incarcerated in Maryland state prisons.
[48] “Report on Workforce Development Program Outcomes,” Maryland Department of Labor, 2020, http://dlslibrary.state.md.us/publications/JCR/2020/2020_148b.pdf
The programs reporting insufficient funding were WIOA Title I–Adult, WIOA Title I–Dislocated Worker, WIOA Title III Wagner-Peyser Employment Service, and Trade Adjustment Assistance.
For discussion of services provided through WIOA Title I and Title III programs, see box “WIOA 101” in an earlier section of this report.
[49] Except where otherwise noted, all statistics in this section based on Maryland WIOA performance data for program year 2019 (July 2019 to June 2020), with calculations by MDCEP. See the following sources:
https://www2.ed.gov/about/offices/list/ovae/pi/AdultEd/spr/py2019/maryland.pdf
For discussion of services provided by the six WIOA core programs, see box “WIOA 101” in an earlier section of this report.
[50] Economic Policy Institute Family budget Calculator, https://www.epi.org/resources/budget/
[51] See Maryland 2020–2024 WIOA State Plan (endnote 44).
[52] Maryland Department of Labor, 2020, “Report on Workforce Development Program Outcomes.” See endnote 48.
[53] Lincoln Quillian, Devah Pager, Ole Hexe;, and Arnfinn Midtbøen, “Meta-Analysis of Field Experiments Shows No Change in Racial Discrimination in Hiring over Time,” Proceedings of the National Academy of Sciences 114(41), 2017, https://www.pnas.org/content/114/41/10870.full
David Neumark, “Experimental Research on Labor Market Discrimination,” Journal of Economic Literature 56(3), 2018, https://pubs.aeaweb.org/doi/pdfplus/10.1257/jel.20161309
[54] David Cooper and Teresa Kroeger, “Employers Steal Billions from Workers’ Paychecks Each Year,” Economic Policy Institute, 2017, https://www.epi.org/publication/employers-steal-billions-from-workers-paychecks-each-year/
[55] MDCEP analysis of Maryland historical operating budget data, U.S. Census Bureau Population Estimates, and Bureau of Economic Analysis inflation data. Adjusted for inflation using the implicit price deflator for state and local government.
[56] MDCEP analysis of Managing For Results performance data.
[57] Jody Sprinkle, analysis of FY 2012 operating budget for the Department of Labor, Licensing,, and Regulation–business regulation (P00C), Maryland Department of Legislative Services, 2011, https://mgaleg.maryland.gov/Pubs/BudgetFiscal/2012fy-budget-docs-operating-P00C-DLLR-Business-Regulation.pdf
[58] U.S. Department of Labor Unemployment Insurance Performance Data–Timeliness and Quality Reports, 2021, https://oui.doleta.gov/unemploy/btq.asp
[59] Bryan Renbaum, “‘Adjudication Purgatory’ Continues a Year Later with the State’s Unemployment System, MarylandReporter.com, March 8, 2021, https://marylandreporter.com/2021/03/08/adjudication-purgatory-continues-a-year-later-with-the-states-unemployment-system/
[60] Chris Van Hollen, Benjamin Cardin, Steny Hoyer, C.A. Dutch Ruppersberger, John Sarbanes, Andy Harris, Jamie Raskin, Anthony Brown, David Trone, and Kweisi Mfume to Tiffany Robinson, August 27, 2021, https://www.vanhollen.senate.gov/imo/media/doc/Delegation%20letter%20to%20MDOL%208-27-21%20(002).pdf
[61] Jack Hogan, “Legislature Votes to Volster Unemployment Insurance System,” MarylandReporter.com, April 7, 2021, https://marylandreporter.com/2021/04/07/legislature-votes-to-bolster-unemployment-insurance-system/
[62] MDCEP analysis of Maryland historical operating budget data and Bureau of Labor Statistics Local Area Unemployment Statistics.
[63] U.S. Department of Labor Unemployment Insurance Performance Data–UI Replacement Rates Report, 2021, https://oui.doleta.gov/unemploy/ui_replacement_rates.asp
[64] Meyer, 2021, “‘Back to Normal’?”
[65] Josh Bivens, Melissa Boteach, Rachel Deutsch, Francisco Diez, Rebecca Dixon, Brian Galle, Alix Gould-Werth, Nicole Marquez, Lily Roberts, Heidi Shierholz, William Spriggs, and Andrew Stettner, “Section 3. Eligibility” in Reforming Unemployment Insurance: Stabilizing a System in Crisis and Laying the Foundation for Equity, a joint report of the Center for American Progress, Center for Popular Democracy, Economic Policy Institute, Groundwork Collaborative, National Employment Law Project, National Women’s Law Center, and Washington Center for Equitable Growth, 2021, https://www.epi.org/publication/section-3-eligibility-update-ui-eligibility-to-match-the-modern-workforce-and-guarantee-benefits-to-everyone-looking-for-work-but-still-jobless-through-no-fault-of-their-own/
[66] Alison Knezevich, “Most Marylanders on Unemployment Insurance Are on Federal Programs. Those End this Week.” The Baltimore Sun, June 25, 2021, https://www.baltimoresun.com/politics/bs-md-federal-benefits-numbers-20210625-xqbso5pfdfdipplsg3zxygiig4-story.html
[67] Keith Wardrip, Stuart Andreason, and Mels de Zeeuw, “Uneven Opportunity: Exploring Employers’ Educational Preferences for Middle-Skills Jobs,” Federal Reserve Bank of Philadelphia, 2017, https://www.philadelphiafed.org/-/media/frbp/assets/community-development/reports/0117-cascade-focus-uneven-opportunity.pdf