Budgeting For Opportunity
How Our Fiscal Policy Choices Can Remove Barriers Facing Marylanders of Color and Advance Shared Prosperity
By Christopher Meyer
Maryland’s budget provides the clearest reflection of our priorities as a state. Choices about where we invest our shared resources can help or hinder children’s education, economic security for families and communities, and public health and safety. Put another way, our budget is a moral document—one that can guide us toward shared prosperity and opportunity for all or toward ever-increasing concentrations of wealth and power in a few hands.
These choices about where we invest our shared resources have the potential to advance or to hinder racial and ethnic equity in Maryland. Even choices that appear neutral on the surface can interact with historical and ongoing forms of discrimination to either obstruct or assist Marylanders of color as they seek to contribute to a thriving state. Our fiscal policy choices similarly have the potential to promote or obstruct equity along other dimensions, such as gender, gender identity, wealth, and disability.
For our economy to deliver broadly shared prosperity, it needs to be firing on all cylinders. That means that we all do best when each one of us has the necessary tools to reach our full potential. Many of the choices we have made over time have moved us in the right direction, like expanding access to health care and investing in quality public schools. At the same time, too many in our communities—Black Marylanders and other Marylanders of color, in particular—are still locked out of opportunities. By setting our fiscal priorities with an eye toward taking down the barriers that hold many back, we can make greater progress toward shared prosperity. The targeted investments in health, education, and transportation outlined in this report would put our state on the right path.
Yesterday’s Choices Shape Today’s Opportunities
Dismantling the barriers that hold back Marylanders of color is an essential part of building broad prosperity. The reason is simple: Maryland has a long history of policies that discriminated against Black Marylanders and other Marylanders of color, and this history created obstacles that continue to hinder progress today.
Examples can be found at every point in our state’s past and present—the 17th century, when the state enshrined the lifelong enslavement of Black Marylanders in law;[i] the early 20th century, when Baltimore enacted the nation’s first legal system of residential segregation;[ii] and the last decade, when Wells Fargo targeted predatory loans to Black families in Maryland and the U.S. Justice Department found that the Baltimore Police Department engages in systematic racial discrimination.[iii]
The legacy of this discrimination is reflected in significant racial and ethnic disparities in economic security. Today, typical white-headed households in Maryland take home about $26,000 more each year than typical Black-headed households, while Black Maryland workers are nearly twice as likely to be unemployed—that is, actively searching for a job but unable to find one—as white workers. Only half of Black- and Latinx-headed households own their homes, compared to three out of four white-headed households.[iv] After decades of carefully planned policies of residential segregation, Black-headed households whose income is between $100,000 and $125,000 live in neighborhoods with lower incomes and higher poverty rates than white-headed households with income between $60,000 and $75,000.[v]
There is no doubt that we have made progress in some respects. For example, smart health policies have significantly reduced the number of Black children who die in infancy over the last decade. Yet the fact remains: A system that took 400 years to build will require serious, sustained effort to unwind.
The State Budget as a Tool for Increasing Opportunity
To create thriving communities and expand opportunity for all Marylanders, our state spending decisions cannot ignore the ways race-based policies have shaped our state. Policymakers should examine every part of the state budget both to uncover and reverse counterproductive practices from the past and to seek opportunities to actively advance equity today. This report focuses on a subset of Maryland’s budget, examining three areas that are essential to building broadly shared prosperity.
- Health: Promoting a healthy population can lead to lower health care costs and fewer work hours lost to illness, while chronic health problems can get in the way of people reaching their full potential. Due to barriers to accessing health care and conditions in their communities, Marylanders of color are more likely to face health problems like low birth weight and asthma, and are more likely to die at younger ages. Making sure everyone can see a doctor without worrying that it will put them deep in debt and tackling environmental hazards like lead can help us build healthier, more prosperous communities for all.
- Education: Education is one of the foundations of long-term economic growth and opportunity, and Marylanders pride ourselves on having great public schools. Yet over the last decade, we have scaled back our investment in schools. This retreat has hit children of color the hardest. We should update our school funding formula, leave ill-advised cuts in the past, and bring all our school buildings into the 21st
- Transportation: In order to get and maintain a good-paying job, you need to be able to get there. As a result of policymakers’ past transportation and housing policy choices, Black workers lose more hours each year to long commutes than white workers. To open up opportunities to these workers, we should invest in reliable transit and remove barriers like high auto insurance costs and license suspension policies.
Policymakers should also improve the state’s budgeting process by explicitly considering equity when setting Maryland’s fiscal priorities. We can accomplish this by requiring equity analyses in the budget instructions that are distributed to state agencies each year and in the fiscal analyses the Department of Legislative Services prepares for proposed legislation.[vi] These analyses will provide the information policymakers need to pursue a comprehensive racial equity strategy.
Supporting Healthy Communities
A healthy economy starts with a healthy population. Healthy residents have lower medical costs and lose fewer workdays to illness, while research shows that children who face health problems early on in life have a harder time succeeding in school and the workforce.[vii] That’s why our investments in healthy communities—both in the form of medical care and through things like nutrition assistance and environmental protections—are so important for a strong Maryland.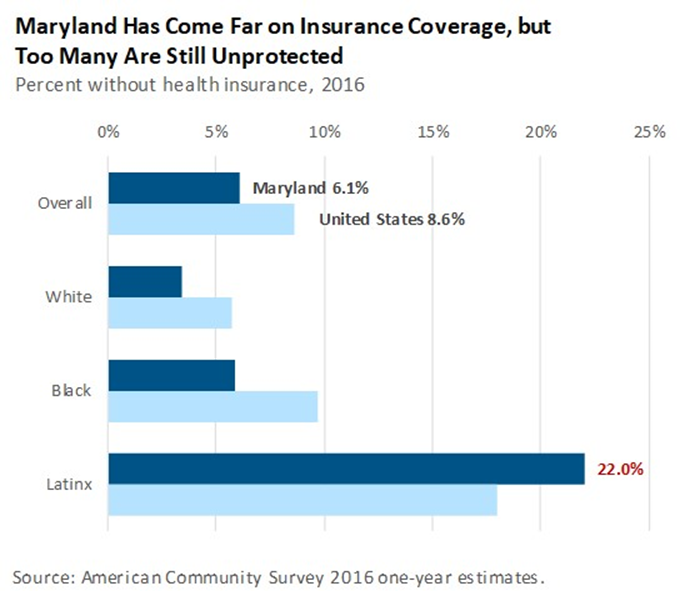
In certain respects, Maryland has a record of making smart choices when it comes to health. For example, our decision to expand access to Medicaid under the Affordable Care Act enables hundreds of thousands of Marylanders to see a doctor when they get sick. In 2013, the year before Medicaid expansion, 10.2 percent of Marylanders were uninsured. That number dropped to 7.9 percent in 2014 and 6.1 percent in 2016, thanks largely to the state’s decision to expand Medicaid.[viii]
While we have made considerable progress in enabling more Marylanders to get medical care when they need it, we still have 363,000 residents without health insurance—and some face a much greater risk of being uninsured. For example, while only one in 30 white Marylanders is uninsured, more than one in five Latinx Marylanders lacks insurance.[ix] One reason for this is that we have not done enough to enable Marylanders born outside the United States to access insurance. Among Marylanders who are permanent residents, here on work or student visas, and other non-U.S. citizens, nearly one-third do not have health insurance.[x] When thousands of our neighbors cannot see a doctor without worrying about going into debt, we are all more likely to get sick or to bear the cost of uncompensated emergency care.
While health insurance is an important condition for accessing medical care, it alone does not guarantee good health. Just as important are factors like access to high-quality doctors and healthy food. Both are distributed across our state in ways that make it harder for Marylanders of color to stay healthy.
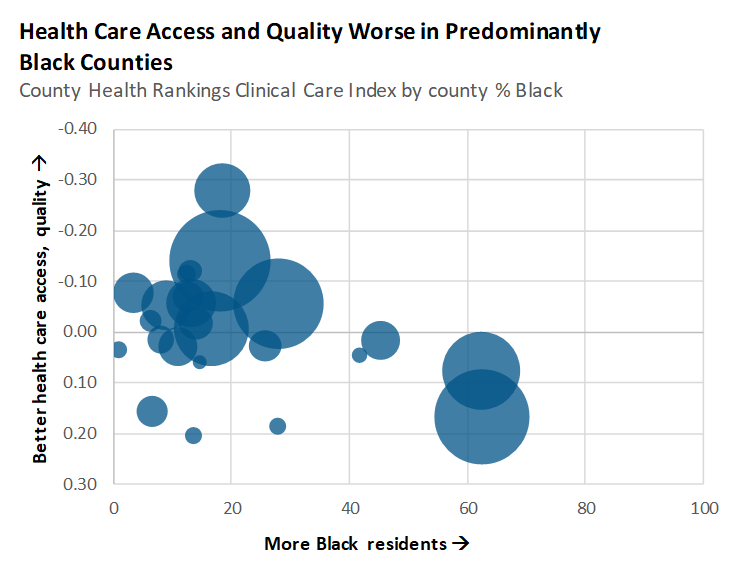
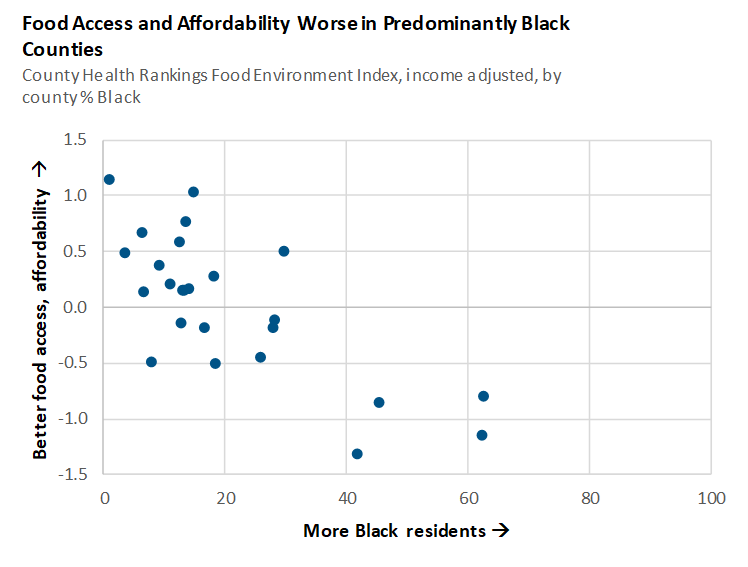
County Health Rankings, a research collaboration between the Robert Wood Johnson Foundation and the University of Wisconsin Population Health Institute, has developed composite measures of counties’ clinical care and food environments. These measures provide a holistic picture of medical care and nutrition in counties.[xi] Here’s what these rankings show in Maryland:
- Black Marylanders are more likely to live in counties with less access to high-quality clinical care. This means they may face higher out of pocket costs, have a harder time getting an appointment, or receive lower-quality care.
- After adjusting for county income, counties with larger shares of Black residents tend to have worse food environments. This means people living in these counties are more likely to live far from a grocery store or have trouble affording food.
In combination, these social and economic factors have a measurable effect on health outcomes, putting Marylanders of color at a greater risk of experiencing health problems:
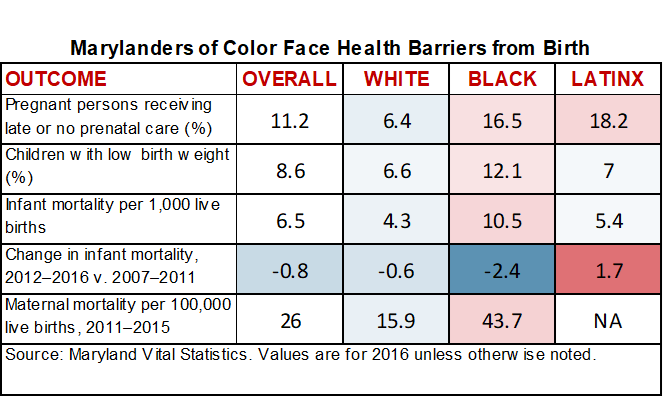
- Both Black mothers and Black children are more than twice as likely as their white counterparts to die during or soon after childbirth.[xii] Both Black and Latinx parents are less likely to receive adequate prenatal health care, and Latinx children are the only group that has experienced an increasing infant mortality rate in recent years.[xiii]
- Black children are exposed to environmental hazards in and near their homes at higher rates than white children. Between 2012 and 2014, Black children in Maryland were twice as likely as white children to have asthma.[xiv] In 2016, children in Baltimore City were five times as likely as those in other counties to have lead poisoning, with the highest rates among those living in rental housing built before 1950.[xv] Black households are more than twice as likely to live in this housing type as white households.[xvi]
- The ultimate result is a higher risk of early death for Marylanders of color. On average, Black Marylanders die three years earlier than white Marylanders, with Black men dying nearly five years earlier than white men.[xvii]
Policy Solutions
We have many opportunities to make Maryland a safer, healthier place if we are willing to make the necessary investments. Here’s where we can start:
- Stabilize and expand access to health insurance. Today, 363,000 Marylanders lack health insurance, and that number is likely to rise as federal efforts to sabotage the Affordable Care Act translate into higher premiums. We should use innovative solutions like a Medicaid buy-in, a basic health plan, or state-level Medicare for all to get more Marylanders insured. We can achieve the biggest immediate gains in coverage by targeting Marylanders born outside the United States.
- Pay competitive reimbursement rates. Maryland needs an abundant supply of health care professionals to ensure that people who are insured through Medicaid can get the care they need, when they need it. But the reimbursement rates we pay providers haven’t always kept up with costs in recent years, as policymakers have treated planned rate adjustments as pots of money they can use to fill other gaps in the budget. Competitive reimbursement rates are essential to ensure that people insured through Medicaid have meaningful access to care, and fully funding planned rate adjustments is the only way to remain competitive.
- Improve infant health. Health problems hold too many Marylanders back from the day they are born. Maryland can make strides by expanding successful strategies Baltimore City has used to drive down infant mortality over the last decade.[xviii] These include home visits for expecting and new parents, access to contraception, and education on safe infant sleep practices. Because parental nutrition before and during pregnancy is so important to healthy development, it is also essential to ensure that all families can afford to put good food on the table.
- Take on lead aggressively. Too many Maryland children are exposed to dangerous levels of lead, and Marylanders of color often have little choice but to live in regions and housing types where the risk is highest. A bold capital investment in ridding homes, schools, and infrastructure of lead would yield benefits for decades to come.
Building Strong Public Schools for All Children
Public education is part of the foundation of thriving communities and a strong economy. Public schools embody our understanding that every child has something to contribute, and our commitment to providing the support children need to learn and thrive. While our state’s best schools demonstrate what is possible when we invest in learning, Maryland’s current education system does not grant all children the same opportunities. Specifically, Black children in Maryland are today more likely to go to school in an aging building in a school district that is funded well below state standards.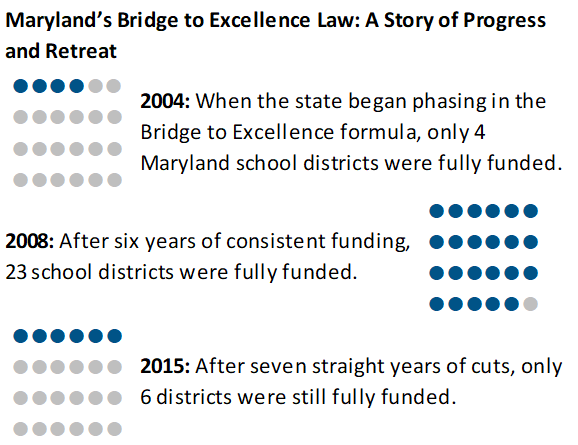
Maryland made significant progress in guaranteeing all children access to high-quality schools during the early years of the 21st century. Following passage of the Bridge to Excellence in Public Schools Act of 2002, the state ramped up education funding based on an analysis of the resources school districts needed to satisfy the state’s academic standards. During this ramp-up, the number of school districts at or close to this standard increased from four in 2004 to 23 in 2008—all but one of Maryland’s 24 county-based school districts.[xix] Students’ test scores also improved substantially during these years across multiple school districts, subjects, and grade levels. For example, in the five districts with the largest shares of Black students, the share of third graders scoring proficient or advanced on the Maryland School Assessment increased by more than 15 percentage points in both reading and math from the 2003–2004 school year to 2007–2008.[xx]
As the Great Recession dragged house prices down and unemployment up, state and local revenues declined. Policymakers responded by suspending scheduled inflation adjustments in our school funding formula from 2009 to 2012 and capping the adjustments through 2015. During these years, improvements in student achievement generally flattened or reversed. For example, the share of third graders in predominantly Black districts scoring proficient or advanced on the Maryland School Assessment in math increased by only 5 percentage points from 2007–2008 to 2011–2012, while the proficient and advanced share in reading increased by only 1 percentage point.[xxi]
Although inflation adjustments have since resumed, the cuts made between 2009 and 2015 continue to harm students. Because inflation builds on itself from each year to the next, skipping an adjustment in one year without an extra-large adjustment the next year means cutting funding in all future years as well. Underfunding is now baked into our formula, even in years when there are no additional cuts. By 2015, the number of fully funded school districts had fallen to six, nearly back to the number in 2004. The results of these cuts are visible in the classroom. Maryland public schools served nearly 36,000 more students in the 2014–2015 school year than in 2007–2008, but the number of teachers and other instructional staff went down.[xxii]
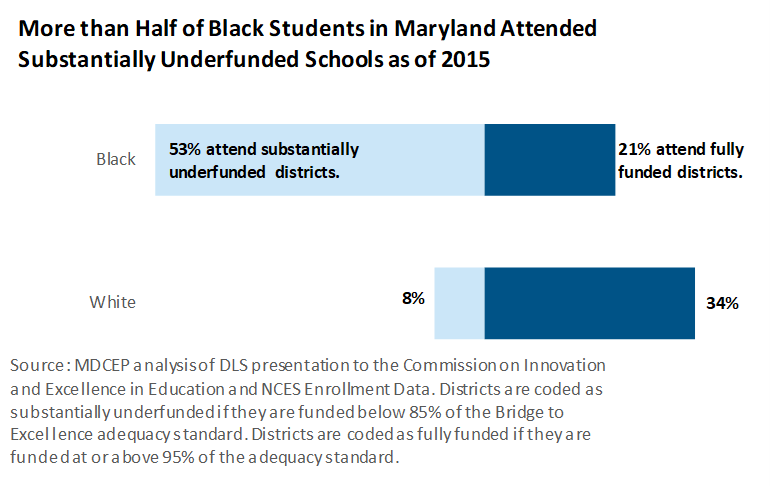
These cuts fell especially hard on Black students in Maryland who, by multiple measures, attend some of the most segregated public schools in the United States.[xxiii] By 2015, more than half of Maryland’s Black students attended school districts that were underfunded by 15 percent or more, compared to only one in twelve white students.[xxiv] Only 21 percent of Black students attended districts that were at least 95 percent funded, compared to 34 percent of white students.
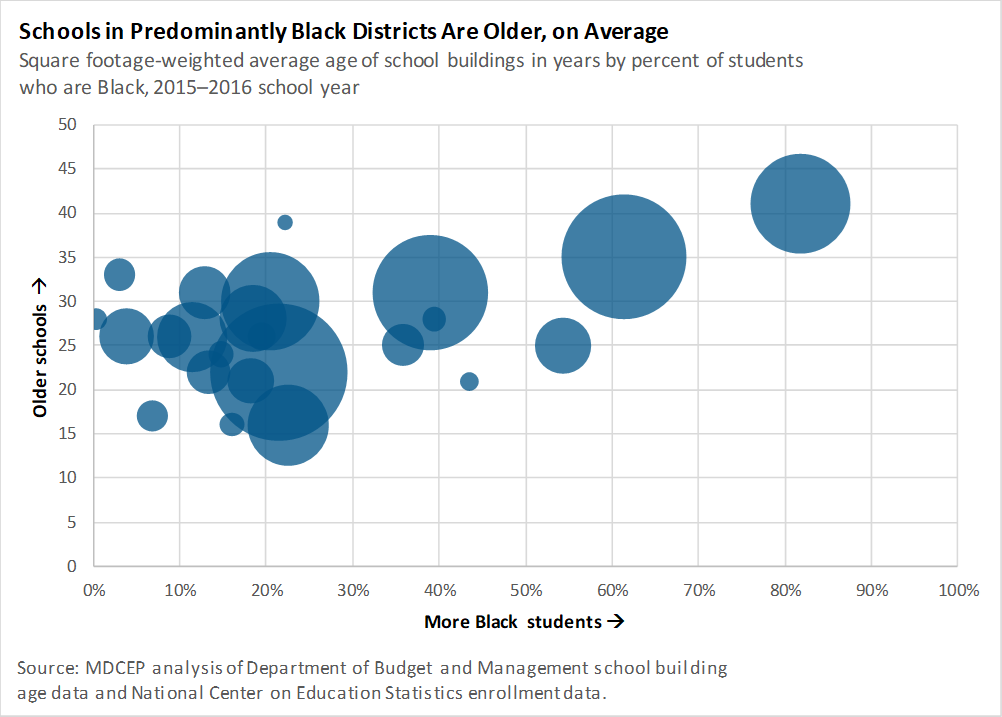
Black students are also more likely to go to school in an aging building, as made vividly clear last winter when Baltimore City children sat huddled in unheated classrooms. Fourteen of the state’s 24 school systems saw the average age of their schools increase from fiscal year 2016 to 2017, and schools in all but one school system were older on average in 2017 than five years earlier. In the most recent data, public schools range from 17 years old on average in Howard and Talbot counties to 42 years old in Baltimore City.[xxv]
Policy Solutions
Maryland’s Commission on Innovation and Excellence in Education (the Kirwan Commission) provides a rare opportunity to enact reforms that will guarantee all children a world-class education. Here are some of the most effective ways we can use this opportunity:
- Where possible, explicitly target resources to underserved schools serving many students of color. Like most states, Maryland’s school funding formula targets additional funding to local school systems that serve large numbers of low-income students. This is appropriate, as voluminous research shows that low-income students (as well as higher-income students who attend high-poverty schools) face challenges that require additional services to overcome. At the same time, income is not the only social factor that affects learning. Research shows that even after holding income constant, Black students face additional barriers to success in school.[xxvi] Likely causes include racial discrimination and physiological stress associated with growing up in segregated neighborhoods. To dismantle these barriers, whenever possible policymakers should explicitly design educational investments to promote racial and ethnic equity.
- Update the school funding formula. The state should update its school funding formula to ensure that schools facing the unique challenges associated with concentrated poverty have the resources to overcome these challenges. This can mean higher staffing levels as well as providing additional services like physical and mental health at school sites.[xxvii] The formula should also ensure that counties with low tax bases receive sufficient state support. While income and even concentrated poverty do not capture the full range of barriers facing Black students and other students of color, they can serve as imperfect proxy measures in cases where flawed legal reasoning closes the door to race-conscious remedies.[xxviii] In the 2015–2016 school year, 61 percent of Black students in Maryland and 58 percent of Latinx students attended schools in which at least half of students were eligible for free or reduced-price meals. Only 18 percent of white students attended these high-poverty schools.[xxix]
- Commit to full funding down the road. A well-designed funding formula is only worth as much as policymakers’ will to implement it. Cuts made in the aftermath of the Great Recession did far-reaching harm to Maryland students, particularly students of color. The state should commit to fully funding the formula and refrain from making permanent cuts in response to revenue shortfalls.
- Invest in modern school facilities. Safe, up-to-date school buildings are an irreplaceable part of providing children a quality education. The state should make an aggressive investment in updating school buildings, prioritizing the aging and deteriorating schools that serve many Black students. Furthermore, school construction projects must be financed in a way that does not penalize cash-strapped jurisdictions. Too often, reliance on local financing up front with a promise of state reimbursement later has held up projects that would have benefitted students of color. [xxx]
Investing in Modern Transportation Networks
Maryland’s prosperity depends on maintaining effective transportation networks to bring people to work and goods to market. For our economy to fire on all cylinders, we must ensure that all Marylanders have reliable transportation to good jobs.
Too often, policymakers’ choices about how to invest in our transportation network have limited opportunity. Among the most emblematic legacies of these policy choices is the unfinished stretch of Route 40 in West Baltimore—a highway whose construction destroyed neighborhoods but provides so little benefit that a months-long closure in 2010 and 2011 drew few complaints.[xxxi] The planned Red Line light rail would have used this roadway in a way that better serves the community, making it easier for people living in West Baltimore to access jobs and services. However, Gov. Larry Hogan abruptly cancelled the project in 2015.
A 21st century transportation system must integrate multiple modes of transportation, and public transit is especially essential to meet the needs of Marylanders of color. Marylanders of color own fewer cars than white Marylanders, on average, and are more likely to live in denser parts of our state that are less suitable for driving because of congestion and high parking costs. As a share of the population, three times as many Marylanders of color depend on public transit as white residents.[xxxii] Marylanders of color are more likely to use transit even outside the state’s heavily urbanized core.
As a result of our past choices about where and how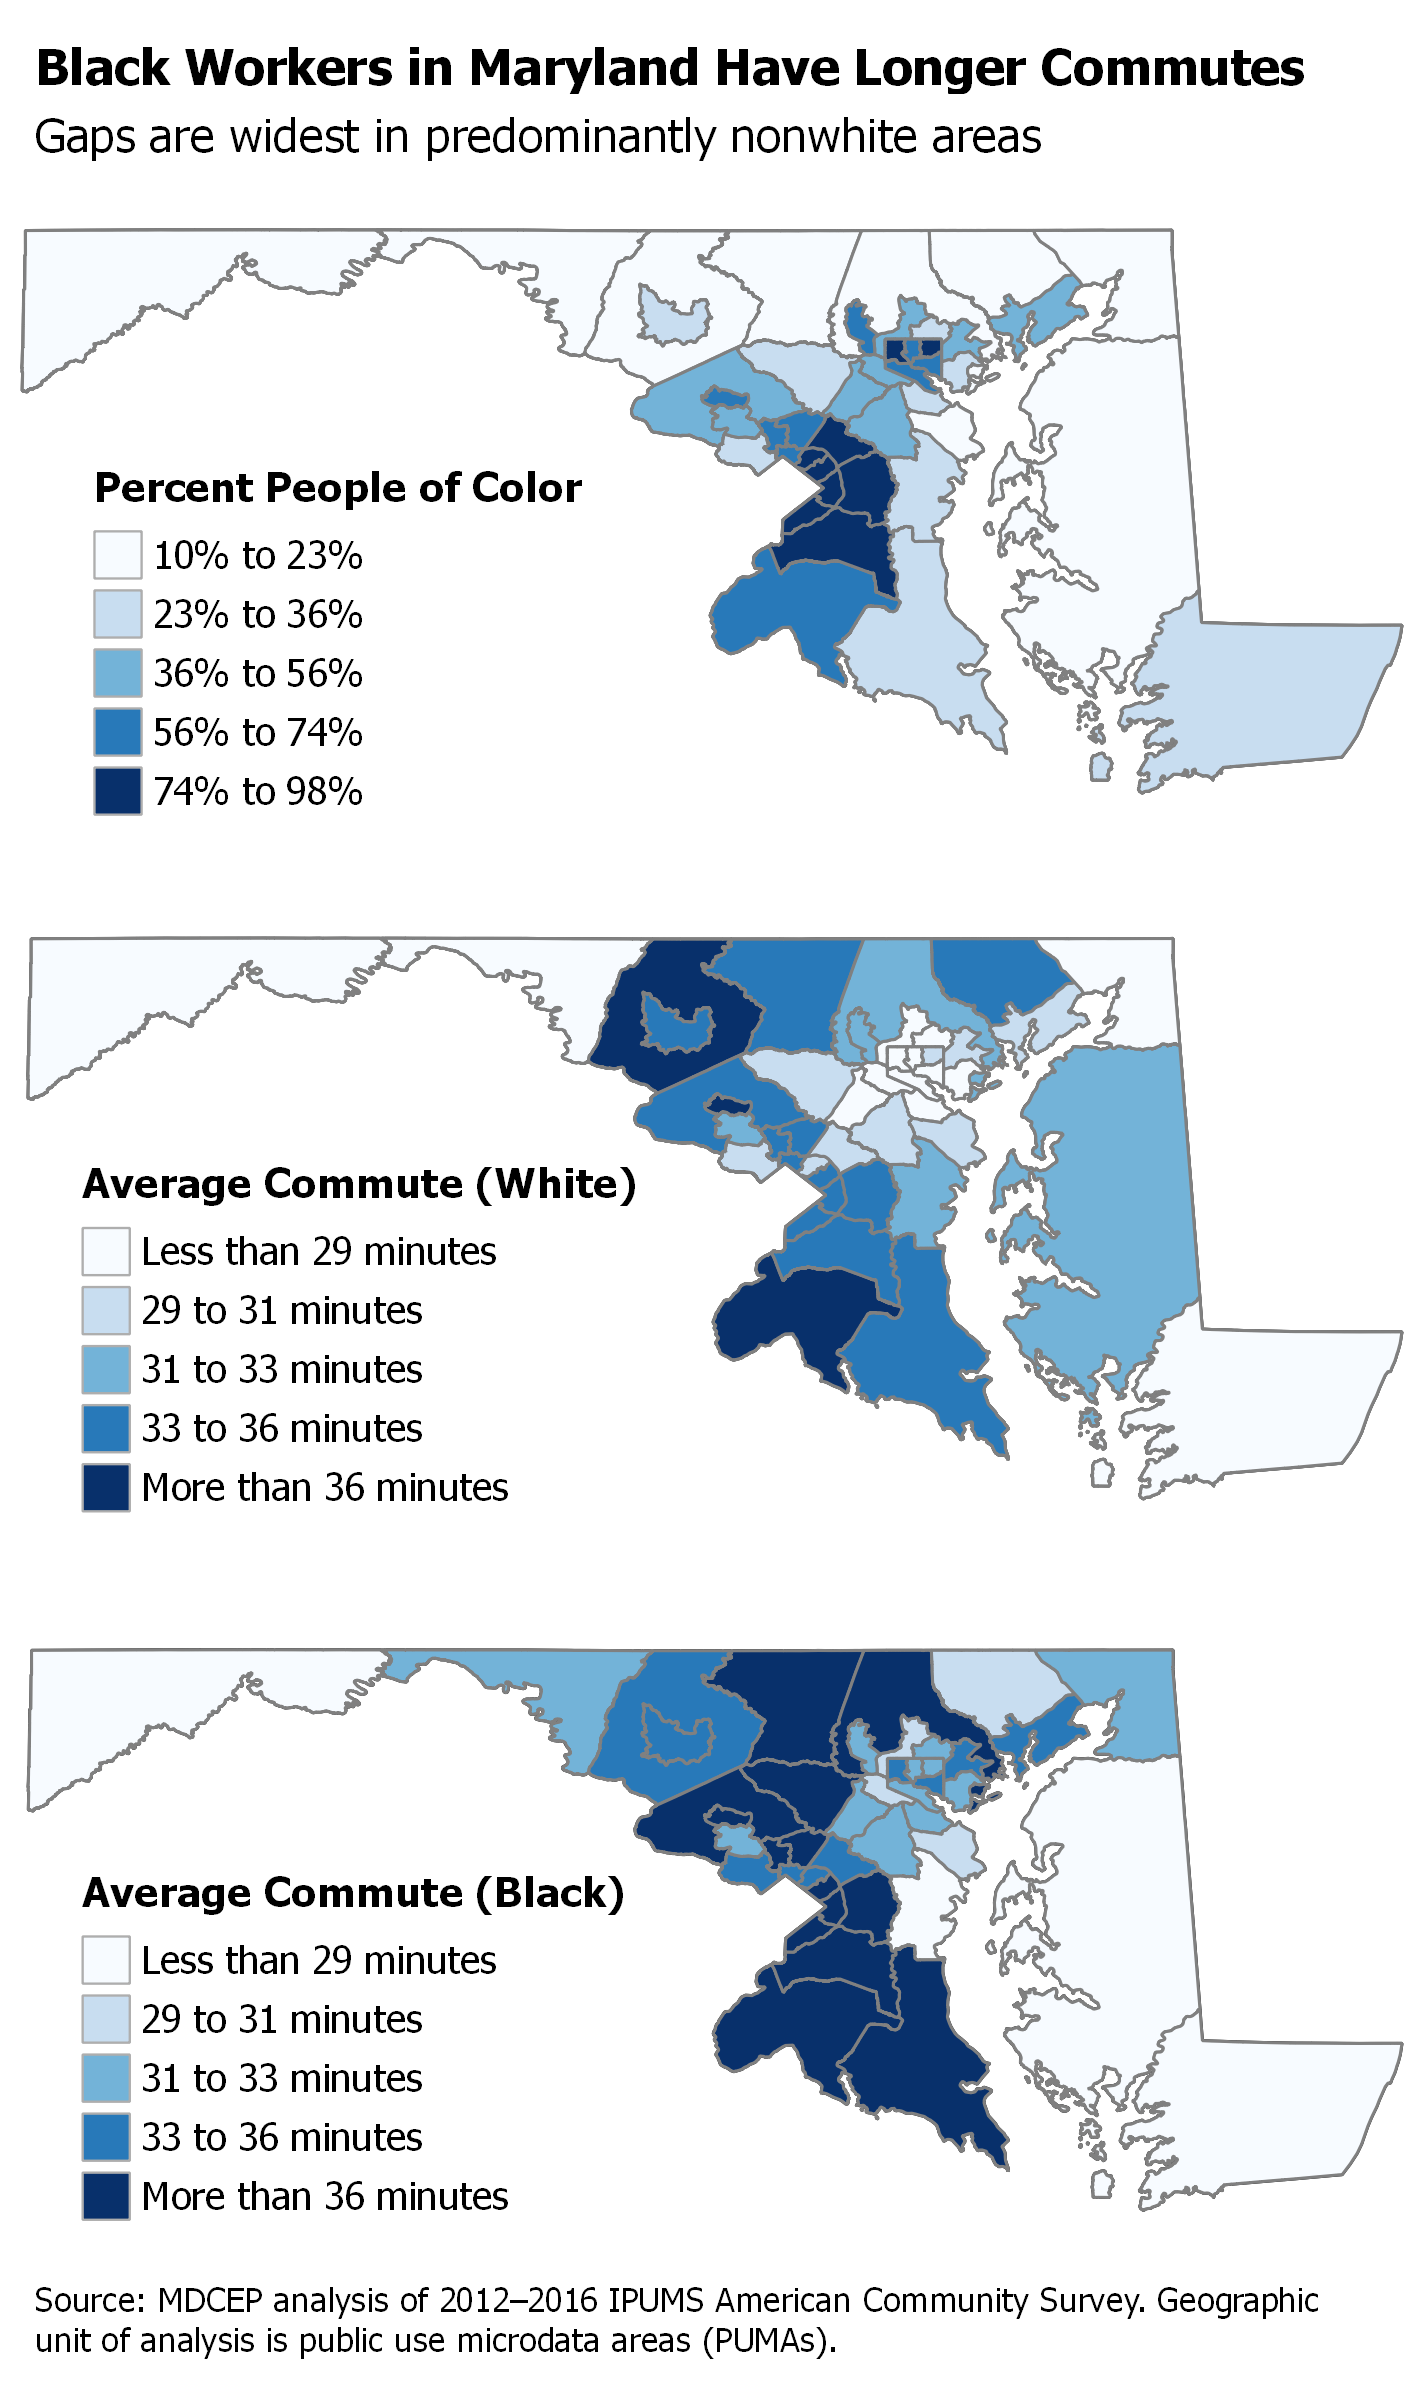 to invest in our transportation system, Black Marylanders have longer commutes to work than their white counterparts on average.[xxxiii] The difference is widest in areas of our state where workers of color live in the highest numbers. Longer commutes mean less access to good jobs, less time to spend with family, and ultimately neighborhood decline.[xxxiv] Here’s an example of how commute times play out in Maryland:
- In northwestern Anne Arundel County, an area that is 56 percent white, Black workers commute an average of 32 minutes each way, three minutes longer than the white average of 29 minutes. One in five Black workers has a one-way commute exceeding 45 minutes, compared to one in seven white workers.
- In southern Prince George’s County, an area that is 75 percent Black, Black workers commute an average of 43 minutes each way, seven minutes longer than the white average of 36 minutes. One-third of Black workers face a one-way commute exceeding 45 minutes, compared to one in four white workers. That means Black workers in southern Prince George’s County spend an average of 55 more hours per year commuting than white workers.
Policy Solutions
It is within our power to take down the barriers that leave too many Marylanders with subpar transportation choices and long commutes. Making smart investments will help us create an economy that is more inclusive as well as more prosperous:
- Make targeted investments in transit. A top priority should be to improve bus service, such as by putting more buses on the road to increase frequency or through larger-scale changes such as bus rapid transit. These investments should be targeted to areas with the longest average commutes, such as Prince George’s County, and with the widest Black-white differences in commute time, such as East and West Baltimore.
- Increase access to cars. There are many parts of Maryland where driving is the best or the only commuting option. We can improve mobility by supporting low-cost insurance policies for drivers who are excluded or priced out of private auto insurance. We should also eliminate counterproductive practices like suspending driver’s licenses for unpaid fines.
- Tackle housing segregation. Perhaps the most powerful tool to improve transportation options for Marylanders of color is outside the state’s transportation budget. Due to decades of deliberate, legally sanctioned discrimination, Black Marylanders today live in lower-income, higher-poverty neighborhoods than their white counterparts, even after controlling for individual income.[xxxv] We should invest in affordable, meaningfully integrated housing and pursue other solutions, like preventing landlords from discriminating against tenants who benefit from housing assistance. These steps will move us toward a Maryland in which everyone is free to live in a thriving community.
![]()
[i] “An Act Concerning Negroes and Other Slaves,” Proceedings and Acts of the General Assembly January 1637/8–September 1664 (Maryland State Archives, 2014), 533–534.
[ii] Garrett Power, “Apartheid Baltimore Style: The Residential Segregation Ordinances of 1910–1913,” Maryland Law Review 42 no. 2, 1982, https://digitalcommons.law.umaryland.edu/cgi/viewcontent.cgi?article=2498&context=mlr
[iii] Luke Broadwater, “Wells Fargo agrees to pay $175m settlement in pricing discrimination suit,” The Baltimore Sun, July 12, 2012, http://articles.baltimoresun.com/2012-07-12/news/bs-md-ci-wells-fargo-20120712_1_mike-heid-wells-fargo-home-mortgage-subprime-mortgages
“Investigation of the Baltimore City Police Department,” U.S. Department of Justice Civil Rights Division, 2016, https://www.justice.gov/crt/file/883296/download
[iv] 2016 American Community Survey one-year estimates. Throughout this report, “Latinx” is used to refer to persons of any gender who identify themselves as Hispanic or Latino on publicly administered surveys. Unless otherwise noted, “white” is used to refer to non-Latinx whites.
[v] MDCEP analysis of 2012–2016 American Community Survey five-year estimates. “Neighborhoods” were defined as census tracts for this analysis.
[vi] Senate Bill 929 of 2018 would have required certain state agencies to assess and if necessary mitigate racial equity impacts before adopting policies, guidelines, or regulations. This bill passed the Senate but then stalled in the House of Delegates. The General Assembly should enact this bill and extend it to include budget instructions and fiscal and policy notes. http://mgaleg.maryland.gov/webmga/frmMain.aspx?pid=billpage&stab=01&id=sb0929&tab=subject3&ys=2018RS
[vii] See for example John Fantuzzo, Whitney LeBoeuf, and Heather Rouse, “An Investigation of the Relations between School Concentrations of Student Risk Factors and Student Educational Well-Being,” Educational Researcher 43 no. 1, 2014, http://journals.sagepub.com/doi/pdf/10.3102/0013189X13512673. This study found that Philadelphia students who were born prematurely or with low birth weight scored 2.9 points lower on reading assessments and 3.8 points lower on math assessments than otherwise-similar students at the same school.
[viii] American Community Survey one-year estimates.
[ix] Ibid.
[x] Ibid.
[xi] “2018 County Health Rankings Report: Maryland,” County Health Rankings, 2018, http://www.countyhealthrankings.org/file/13042/download?token=PINPTMv4. The Clinical Care Index combines data on uninsured residents, the number health care providers, and the adoption of health care best practices. The Food Environment Index combines data on residents experiencing food insecurity and low-income residents who live far from a grocery store.
[xii] “Maryland Vital Statistics Annual Report 2016,” Maryland Department of Health, 2017, https://health.maryland.gov/vsa/Documents/2016_AnnualReport.WebVersion.pdf
[xiii] “Maryland Vital Statistics: Infant Mortality in Maryland, 2016,” Maryland Department of Health, 2017, https://health.maryland.gov/vsa/Documents/Infant_Mortality_Report_2016.pdf
[xiv] MDCEP analysis of Centers for Disease Control and Prevention data on asthma incidence, https://www.cdc.gov/asthma/asthmadata.htm
[xv] “Childhood Blood Lead Surveillance in Maryland: Annual Report 2016,” Maryland Department of the Environment, 2017, http://mde.maryland.gov/programs/LAND/LeadPoisoningPrevention/Documents/Reports/AnnualReportFINAL10_17.pdf
[xvi] 2016 American Community Survey one-year estimates.
[xvii] Maryland Vital Statistics Annual Report 2016. This disparity remains substantial well into men’s 40s, indicating that it is not fully explained by early death due to violence.
[xviii] Luke Broadwater, “Infant mortality in Baltimore decreases to record low,” The Baltimore Sun, October 5, 2016, http://www.baltimoresun.com/health/bs-md-ci-infant-mortality-20161005-story.html
[xix] In 2004, four school districts were at or above 95 percent of the Bridge to Excellence adequacy standard. That number increased to 23 in 2008 before falling back to six in 2015. “Adequacy of Education Funding in Maryland,” Department of Legislative Services presentation to the Commission on Innovation and Excellence in Education, January 9, 2017, http://dls.maryland.gov/pubs/prod/NoPblTabMtg/CmsnInnovEduc/2017_01_09_DLS_Presentation_Adequacy.pdf
[xx] MDCEP analysis of Maryland Report Card student achievement data (http://reportcard.msde.maryland.gov/). The five districts are Baltimore City, Prince George’s County, Charles County, Somerset County, and Dorchester County. This type of observational relationship should be treated with caution, because multiple factors simultaneously affect student achievement. However, this pattern is in line with high-quality research showing a causal relationship between increased school resources and improved student achievement. See for example C. Kirabo Jackson, Rocker Johnson, and Claudia Persico, “The Effects of School Spending on Educational and Economic Outcomes: Evidence from School Finance Reforms,” The Quarterly Journal of Economics 131 no. 1, 2016, http://socrates.berkeley.edu/~ruckerj/Q JE_resubmit_final_version.pdf
[xxi] MDCEP analysis of Maryland Report Card student achievement data. The flattening or reversal of achievement gains generally did not begin immediately in 2008 but rather occurred on a lag. This is consistent with the benefits of school resources accumulating over multiple years. Once again, it is not possible in observational data to isolate the effect of funding cuts from other factors that may have affected student achievement. Changes in curriculum and assessment confound comparisons beyond 2012.
[xxii] MDCEP analysis of Maryland Report Card enrollment data and National Center for Education Statistics staffing data (https://nces.ed.gov/ccd/pubagency.asp).
[xxiii] Gary Orfield, Jongyeon Ee, Erica Frankenberg, and Genevieve Siegel-Hawley, “Brown at 62: School Segregation by Race, Poverty, and State,” UCLA Civil Rights Project, 2016, https://www.civilrightsproject.ucla.edu/research/k-12-education/integration-and-diversity/brown-at-62-school-segregation-by-race-poverty-and-state/Brown-at-62-final-corrected-2.pdf
[xxiv] MDCEP analysis of data from DLS analysis of funding adequacy and National Center for Education Statistics enrollment data by race for the 2014–2015 school year.
[xxv] MDCEP analysis of Maryland Interagency Committee on School Construction performance data (http://dbm.maryland.gov/budget/Documents/operbudget/2019/agency/D25-Interagency-Committee-on-School-Construction-MFR.csv).
[xxvi] See for example Bruce Baker, “Exploring the Sensitivity of Education Costs to Racial Composition of Schools and Race-Neutral Alternative Measures: A Cost Function Application to Missouri,” Peabody Journal of Education 86 no. 1, 2011, https://www.tandfonline.com/doi/abs/10.1080/0161956X.2011.539957
[xxvii] Research shows that providing supportive services such as physical and mental health through the community schools model can improve students’ wellbeing and academic outcomes. See Jeannie Oakes, Ana Maier, and Julia Daniel, “Community Schools: An Evidence-Based Strategy for Equitable School Improvement,” National Education Policy Center, 2017, https://learningpolicyinstitute.org/sites/default/files/product-files/Community_Schools_Evidence_Based_Strategy_BRIEF.pdf
[xxviii] For a discussion of legal issues raised by race-conscious school finance policy, including the flaws in arguments against race-conscious policy, see Preston Greene, Bruce Baker, and Joseph Oluwole, “Race-Conscious Funding Strategies and School Finance Litigation,” Boston University Public Interest Law Journal 16, 2006, http://www.bu.edu/law/journals-archive/pilj/vol16no1/documents/16-1greenbakeroluwolearticle.pdf
[xxix] MDCEP analysis of Maryland Report Card data on students receiving special services and NCES data on enrollment by race. This is not merely a product of Black students being more likely to be in low-income families themselves. Due in large part to housing segregation, low-income Black children live in higher-poverty neighborhoods than low-income white children, on average, and higher-income Black children live in higher-poverty neighborhoods than higher-income white children (MDCEP analysis of 2012–2016 American Community Survey five-year estimates).
[xxx] Luke Broadwater, “”Baltimore schools have returned millions in state funds for heating repairs,” The Baltimore Sun, January 4, 2018, http://www.baltimoresun.com/news/maryland/education/bs-md-ci-schools-money-returned-20180104-story.html
[xxxi] Gerald Neily, “‘Highway to Nowhere’ shut down—and Baltimore doesn’t notice,” Baltimore Brew, February 1, 2011, https://www.baltimorebrew.com/2011/02/01/highway-to-nowhere-shut-down-and-baltimore-doesnt-notice/
[xxxii] MDCEP analysis of 2012–2016 American Community Survey five-year estimates.
[xxxiii] MDCEP analysis of 2012–2016 IPUMS American Community Survey microdata.
[xxxiv] “What Happened in Baltimore and What Can We Do? A Neighborhoods Perspective,” Baltimore Neighborhood Indicators Alliance, 2016, https://bniajfi.org/wp-content/uploads/2016/01/WhatHappenedReport.pdf
[xxxv] MDCEP analysis of 2012–2016 American Community Survey five-year estimates. For detail on de jure racial housing segregation in Maryland and elsewhere, see Richard Rothstein, The Color of Law: A Forgotten History of How our Government Segregated America (New York: Liveright, 2017).