Access to Opportunity: Implications of Implementing Small Area Fair Market Rent in Baltimore’s Neighborhoods
By Musaab Ibrahim and Taneeka Richardson
Technical Support and Data Visualization by Cheryl Knott
This project was made possible through a grant from the Robert Wood Johnson Foundation and the Urban Institute. The Maryland Center on Economic Policy (MDCEP) was the recipient of funding for the Baltimore Metro area and partnered with the Baltimore Neighborhood Indicators Alliance-Jacob France Institute (BNIA-JFI) to create the data visualization tool.
Introduction
Having a safe place to live and raise a family is critical to economic security, health, and many other aspects of daily life. Maryland has some of the highest housing costs in the country[i] and, despite recent progress on tenants’ rights and worker protections like raising the state’s minimum wage and guaranteeing paid leave, too many people are forced to pay far more than they can afford in rent or accept unsafe, unhealthy housing conditions.
As in most metropolitan areas throughout the nation, in Baltimore City from 2007 to 2017 the homeownership rate fell from 51% to 47%. For Black homeowners the drop was more dire – the ownership rate decreased to 42%. This trend is a part of a national decline in Black homeownership that started during the foreclosure crisis of the Great Recession in 2007 and continued through to the housing unaffordability and instability stemming from the COVID-19 pandemic.
Research has shown that the most stable housing markets in the Baltimore region are characterized by housing diversity, where different kinds of households have real possibilities for either homeownership, renting, or using housing choice vouchers (assisted rent). Providing realistic housing options for a range of household incomes in Baltimore’s most stressed communities as well as its strongest markets would increase housing diversity in every neighborhood. Housing diversity matters because the strength of the housing market is correlated with better outcomes for families[ii].
This project builds upon existing local research by the Baltimore Neighborhood Indicators Alliance (BNIA). BNIA began tracking the rate of voucher holders by community in Baltimore in 2014 and found that areas disproportionately impacted by the 2008 housing market crisis, where homeowners had negative equity in their properties, were subsequently experiencing high rates of voucher use. In their 2022 report on how affordability changed in Baltimore over the past decade, the data shows that some neighborhoods are becoming housing voucher submarkets with three times the rate of voucher use of the citywide average. This research examines the effects of Baltimore City adopting the Small Area Fair Market Rent guidelines from the US Department of Housing and Urban Development (HUD) versus the city’s current practice of using metro area 50th percentile Fair Market Rent. The report uses data maps to demonstrate the spatial distribution of housing vouchers using housing voucher data; demographic information, such as race/ethnicity; housing affordability; income; and gross median rent, owner-occupancy data, and homes sold for cash.
Key Findings
- The Housing Choice Voucher program in Baltimore City has led to artificial inflation of existing rental prices in middle-market neighborhoods, resulting in market pressure among other renters in the same neighborhood, causing unassisted renters to struggle to pay rent. Although the rent burden in Baltimore City has decreased over the last decade overall, there has been a significant increase in a select few neighborhoods in the number of people spending more than 30% of their income on rent.
- Through our data visualization tool, we show that the neighborhoods with the highest voucher use saw the greatest increases in rent burden, while in theory the voucher should cap the rent to 30% of the tenant’s income. Belair-Edison, Edmonson Village, McElderry Park, and Pigtown/Carroll Park are examples of areas experiencing high rates of voucher usage and high rates of rental unaffordability.
- The current payment standards for vouchers are based on the Baltimore metro statistical area, encompassing a large urban region that skews rents lower in high-opportunity areas and higher in low-opportunity areas. Using Small Area Fair Market Rent (SAFMR) instead adjusts the voucher payment standards using ZIP-code-level data instead of the metropolitan statistical area, capturing local submarket variation between neighborhood rents as opposed to metro-wide fair market rents.
- Implementing SAFMR would raise the rent ceilings in high-opportunity neighborhoods and decrease the rent ceiling in low-opportunity neighborhoods. This will increase the affordability of higher-opportunity neighborhoods by increasing the affordable housing units in those areas.
- Adjusting the rent ceilings to account for neighborhood variations can reduce the concentration of voucher holders by reducing payment ceilings in low-income neighborhoods. This could also decrease the rent burden for renters who don’t receive housing assistance. Based on the payment standard, voucher holders’ options increase in high-opportunity neighborhoods. They are also susceptible to decreases in rent ceilings, as many voucher holders cluster in low-income neighborhoods. Using local census level rents in setting payment standards can capture local housing markets conditions greater than metro level FMRs or SAFMR.
- Public housing authorities have mechanisms to help low-income families keep their voucher payments from abruptly decreasing through one of four ways. (1) Maintain the regular practice of applying reductions at the second annual review, which gives families one to two years of notice before the new payment standard goes into effect; (2) Phase the payment standard reduction in gradually, for example by applying a 15% percent payment standard reduction in three increments of 5% percent per year (with the first part of the reduction going into effect no sooner than the second annual review); (3) Permanently hold families harmless by continuing to use the previous, higher payment standard for as long as a family remains in the same unit; (4) Applying a portion of the reduction and then holding families harmless after that, for example by applying only 5 percentage points of a 15% percent reduction (again no sooner than the second annual review).
- PHAs should consider implementing SAFMR and monitoring the outcomes while also implementing policies to avoid unintended consequences. Should SAFMR be implemented in the Baltimore-Columbia-Towson region, it could lead to a net increase in listings that are accessible to voucher holders, particularly if safeguards are implemented to protect low-income ZIP codes from decreased payment standards.
Explore the full Baltimore Metro Area housing landscape data tool
Concentrated Use of Housing Choice Vouchers
The Housing Choice Voucher Program, the nation’s largest federal rental assistance program, assists over 5 million people in 2.2 million low-income households. Housing Choice Vouchers help families afford decent and stable housing, avoid homelessness, and meet their other basic needs. When implemented properly, vouchers can give low-income families real choices about where to live —including the chance to live in lower-poverty, higher-opportunity neighborhoods — and help public housing agencies meet their legal obligation to address housing discrimination and segregation. Despite the program’s success, only 1 in 4 households that qualify for housing assistance receive it due to inadequate funding. In Baltimore, while more than 17,000 households have access to a housing voucher, an additional 23,000 households are on a waiting list[iii].
Voucher-affordable units may be concentrated in neighborhoods of greater or lesser opportunity due to market or historical dynamics unique to a particular metro area, such as exclusionary zoning, geography, access to public transportation, historical segregation-related policies like redlining, and more. A Center on Budget and Policy Priorities analysis found that voucher-assisted families with children tend to be more clustered in neighborhoods that: (a) score in the bottom 20% of their opportunity index (defined as accessible to jobs, transportation, and public goods and services), (b) have high poverty rates, or (c) have larger shares of residents who are people of color, relative to voucher-affordable units. This means that voucher holders mainly rent units in low-income areas where other voucher holders, largely people of color, reside. The differences are sometimes quite pronounced depending on the metropolitan area. For example, in some metro areas, voucher-affordable rental units are relatively scarce in low-poverty neighborhoods or disproportionately concentrated in high-poverty neighborhoods.[iv] In Baltimore, the share of voucher-assisted families living in low-opportunity neighborhoods is higher than the share of affordable housing in those areas, suggesting that there’s a higher proportion of voucher holders within low-opportunity neighborhoods than there should be based on the affordable housing stock.
For housing markets in metro areas such as Baltimore, the instability resulting from the Great Recession led to some areas with exclusive, high-priced options that only high-income households can afford and other middle-market, and lower-income neighborhoods. The most stable housing markets in the Baltimore region are characterized by their housing diversity. Some neighborhoods in Baltimore, however, have practically no options for voucher holders while others have become a magnet for voucher use with more than three times more than the citywide average.[v]
State and local housing agencies that administer the voucher program in metropolitan areas like Baltimore may find it more difficult to help interested families move to low-poverty areas. Conversely, in metropolitan areas with more voucher-affordable units in low-poverty neighborhoods, agencies may find it easier to assist families wishing to move to these areas. To help set reasonable expectations for how local voucher programs can do more to give families the chance to move to lower-poverty, higher-opportunity neighborhoods, it’s critical to examine the percentage of voucher-assisted families in a given type of neighborhood and compare that to the underlying affordable rental market.
Concentrated Voucher Use is Inflating Rental Prices
The housing voucher program has led to artificial inflation of existing rental prices in middle-market neighborhoods (neighborhoods that are neither the poorest nor the wealthiest in a city). This has resulted in market pressure among unassisted renters in the same neighborhood, causing those without housing assistance to struggle to pay rent. Although the rent burden in Baltimore City has decreased over the last decade overall, there has been a significant increase in a select few neighborhoods in the number of people spending more than 30% of their income on rent, the metric for what is generally considered affordable. The neighborhoods with the highest voucher use saw the greatest increases in rent burden.
Data from BNIA’s Vital Signs[vi] report point to a strange paradox: the top three neighborhoods in Baltimore with high housing voucher use (i.e., households that are using a voucher to offset the cost of rental housing) also have the highest percentage of renters spending more than 30 percent of their income on rent.[vii] The housing voucher is meant to prevent households from spending more than 30% of their income on rent. So how can it be that high voucher use neighborhoods also have a high rent burden?
Housing costs are a burden for households on a fixed- or low-income, those who have experienced job loss or displacement, or for those living in areas where housing values are increasing rapidly. Federal housing choice vouchers assist households by subsidizing rent so that households do not spend more than 30% of their income on housing. Additionally, local public housing authorities are allowed to range the income cap between 30-40%. Local public housing authorities (PHA) set the Fair Market Rent (FMRs) using guidelines from the US Department of Housing and Urban Development.[viii] In Baltimore, the Housing Authority of Baltimore City (HABC) is responsible for this, however there are other public housing authorities such as the Baltimore Regional Housing Partnership. Voucher holders are tasked with finding a landlord that will accept their voucher. The landlord, tenant, and the housing authority form an agreement that caps the tenant’s share of the rent at 30% of their income and limits the max rent to the payment standard. As shown in the table below, Baltimore has a mostly uniform rent standard at 110% of FMR for all except a handful of census tracts in the city, where payment standards are above 110%.[ix]
Table 1: Census Tracts at 110% of FMR – All Remaining Census Tracts[x]
| Unit Size | FMRs | 110% |
| 0 | $1,173 | $1,290 |
| 1 | $1,359 | $1,494 |
| 2 | $1,678 | $1,845 |
| 3 | $2,177 | $2,394 |
| 4 | $2,491 | $2,740 |
| 5 | $2,864 | $3,150 |
| 6 | $3,238 | $3,561 |
| 7 | $3,611 | $3,972 |
Because the voucher has the same max value nearly anywhere in the city, households with a voucher are welcomed by property owners in neighborhoods that would typically command an equal or often lower rent on the private rental market. These are stable neighborhoods, like Belair-Edison and Pigtown/Carroll Park. Given the moderately-priced homes, these are the same neighborhoods in which households who are not receiving housing assistance are seeking to rent. This dynamic creates a very localized market pressure among renter neighbors in the same neighborhood, which causes challenges particularly for the renters without any housing assistance. As housing voucher rates increase, the percentage of households spending more than 30% of their income on rent is increasing and yet, owner-occupancy in moderately-priced homes is decreasing.
Many communities believe that high homeownership is a sign of a healthy neighborhood. However, tracking this measure for neighborhoods between 2010-2020, the Vital Signs report shows that the percentage of homeownership in any community alone does not represent a sign of stability; rather, it is the rate of change in owner-occupancy from either stable or fast-changing that can cause the fabric of a community to shift. For example, neighborhoods like Midtown or Greater Charles Village/Barclay have a below-average owner-occupancy (41% and 42% respectively) but have been steady at those levels for more than a decade. Both communities have seen reductions in vacancy rates and increases in population, without any change in homeownership rates.[xi] These indicators are clearly interrelated, suggesting that the for-sale market and rental markets (assisted or unassisted) in a community are also interrelated.
This is best illustrated through spatial analysis of where voucher recipients reside and rental affordability in Baltimore City.
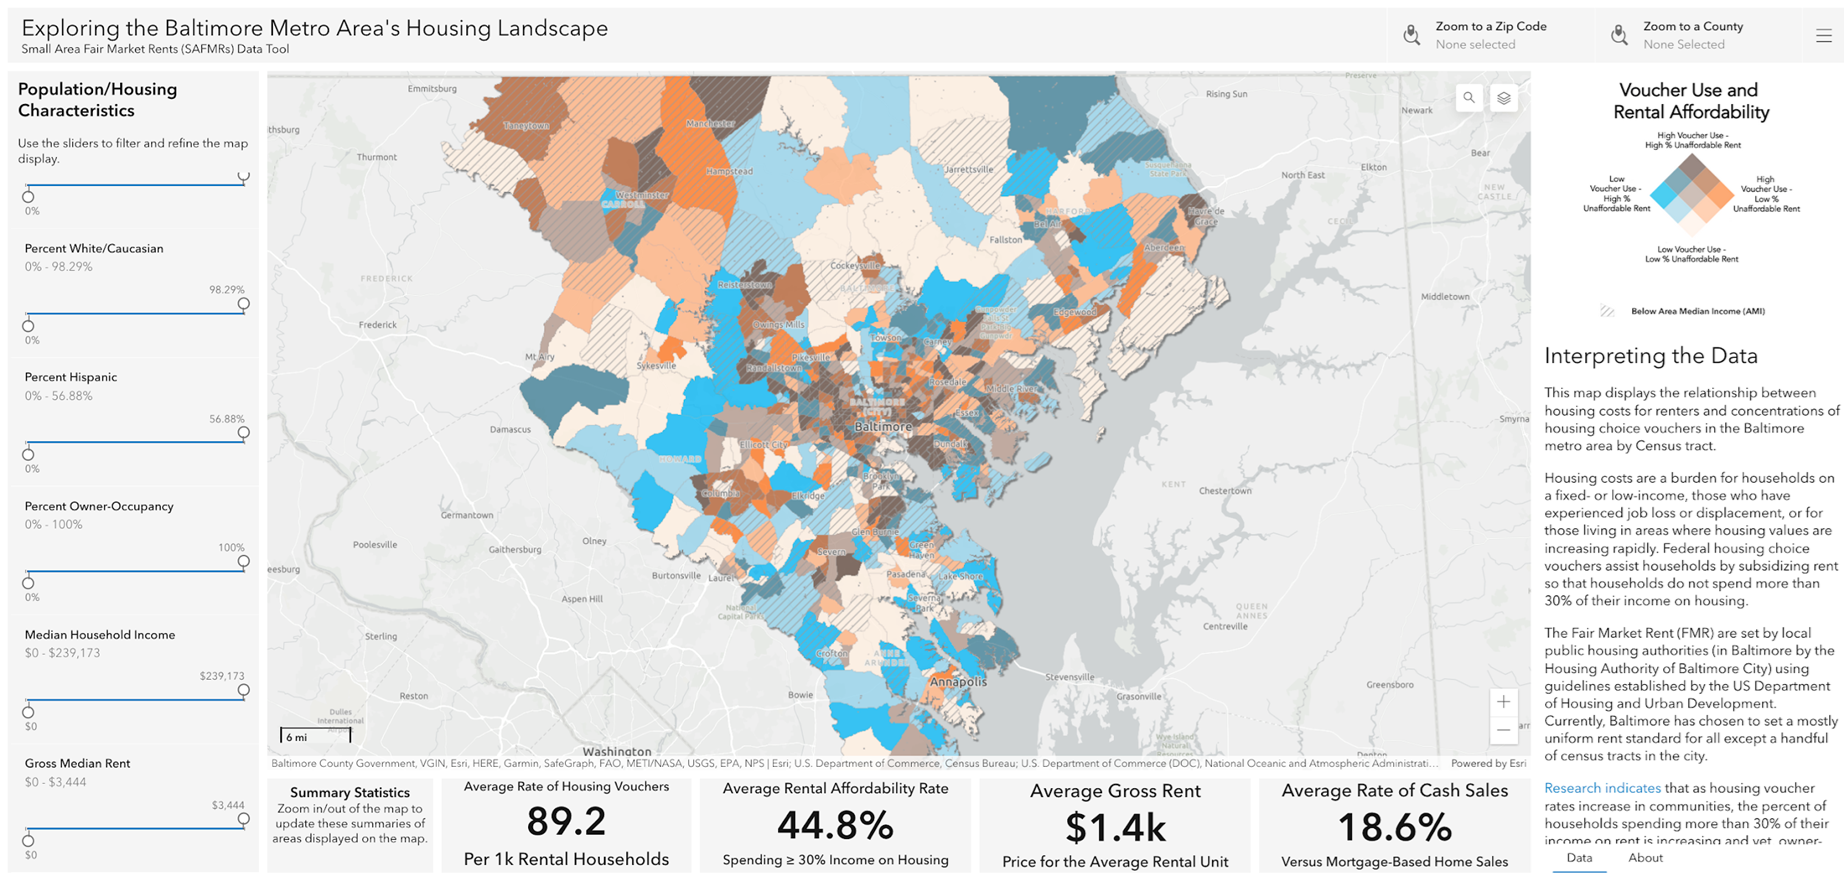
Map A: Baltimore Metro Area’s Housing Landscape via indicators[xii]
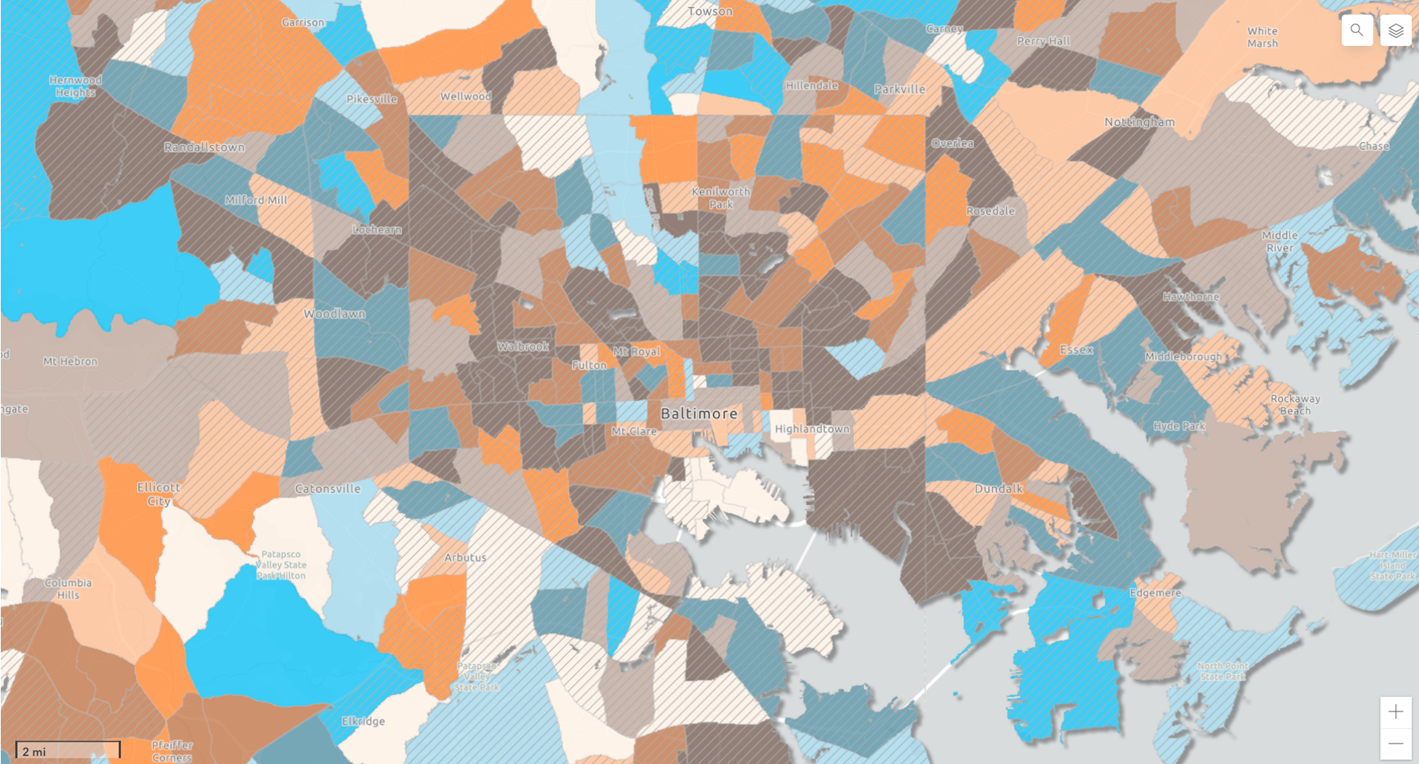
Map B: Voucher use by rental affordability
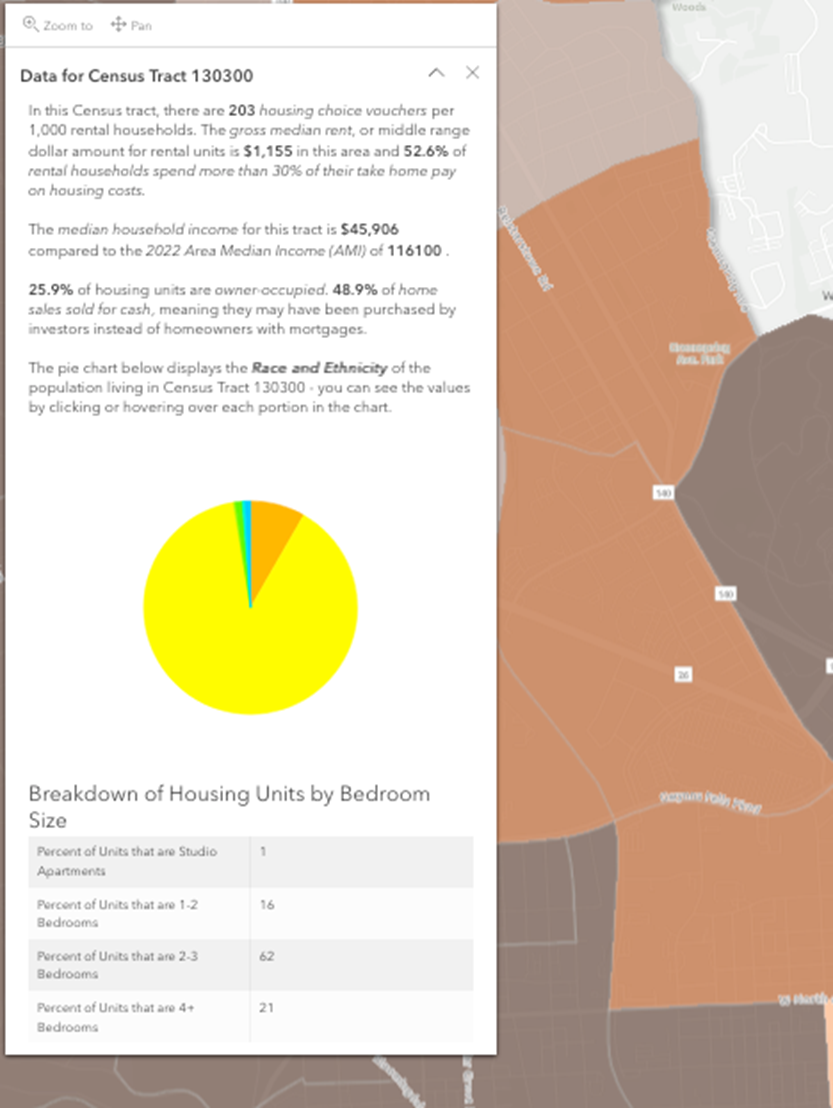
Map C: Breakdown of demographics
Explore the full Baltimore Metro Area housing landscape data tool
The areas shaded dark on Map B are census tracts with a high rate of voucher use and high rate of rental unaffordability. The areas overlaid with diagonal stripes represent areas below the Area Median Income (AMI). For Baltimore City, the AMI is $116,000[xiii]. Neighborhoods such as Belair-Edison, Edmonson Village, Pigtown/Carroll Park, and McElderry Park are a few examples of these clustered voucher units:
Table 2: Breakdown of Community Indicators for Areas with High Rates of Voucher Utilization, 2020
| Neighborhood | Average Rate of Vouchers per 1,000 Rental Housing Units (2020) | Gross Median Rent (2017-2021) | Percent of Rental Households Spending ≥ 30% of Income on Housing Costs (2017-2021) | Percent of Properties that are Owner Occupied (2021) | Percent of Residential Home Sales for Cash (2021) |
| Belair-Edison | 405.4 | $1,300 | 61.8% | 51% | 34.7% |
| Edmonson Village | 255.6 | $1,100[xiv] | 60.0% | 41-67% | 41.0% |
| McElderry Park | 302.0 | $1,234 | 61.6% | 22.1% | 50.5% |
| Pigtown/Carroll Park | 219.0 | $1,250 | 41.9% | 45.8% | 8.4% |
Data Sources: HUD Picture of Subsidized Housing, U.S. Census Bureau American Community Survey, MdProperty View, RBIntel.
Voucher Holders Experience: Challenges Finding ‘Decent’ Housing
To get a clearer understanding of why voucher holders cluster in these neighborhoods, we interviewed stakeholders familiar with the housing choice voucher program for their input. One factor these conversations highlighted is the uptick of investment activity in the housing market, when investors acquire homes and complexes in low-income areas and fit them to lease to voucher tenants, resulting in disproportionately higher rates of voucher use in certain neighborhoods. To assess this, we analyzed the percentage of cash sales in a particular neighborhood. Cash sales can be a proxy for real estate investment activity, as most homeowners buying a home to live in are likely to finance with a mortgage rather than pay in cash. Other key factors include the rental affordability of certain neighborhoods within Baltimore City that are located within low-opportunity areas. These neighborhoods, considered pockets of affordability in Baltimore City, tend to be where voucher holders can find the most available units. However, these neighborhoods are now experiencing increased rent burdens as the rate of voucher usage increases, putting pressure on unassisted renters looking for affordable units.
Other stakeholders described the limited affordable housing stock being a major factor. Voucher holders who are seniors, have children, and/or have disabilities, find it difficult to find affordable housing due a range of factors including source of income and other forms of discrimination, adequate housing amenities, credit history requirements, and lack of outreach from the housing authority.
During an interview with a voucher holder, we asked them to describe their experience finding affordable housing in Baltimore City. Their biggest struggle was finding “decent,” affordable housing. Certain property sites rejected their voucher based on their source of income, despite them qualifying for the unit. Their search steered them towards neighborhoods that already had clusters of voucher holders, as these units were what was tolerable and accessible. They also expressed difficulty finding rental units that fit their needs. Voucher holders have an initial term of only 60 days to find a landlord that accepts their voucher, while having to do much of the searching for units that they desire. An additional 30 day extension can be requested, but the voucher limit is no more than 120 days.
In 2019, Baltimore enacted legislation that prohibits discrimination in rental housing based on the tenant’s source of income. Landlords can no longer refuse to accept Housing Choice Vouchers or to refuse to accept co-signers for tenants who lack the income to pay the rent on their own.[xv] In theory, this should give voucher holders more housing options yet, as shown in the visualization, voucher holders still cluster in low- to moderate-income neighborhoods.
Voucher Payment Standards May Artificially Inflate Rents
Landlords in low- and moderate-income neighborhoods can inflate their rental prices by renting to voucher holders near or at the payment standard, or the rent ceiling, particularly if the unit was renovated. In low-income neighborhoods, this potential price difference incentivizes property owners in these neighborhoods to charge near or at the rent ceiling, when a unit rented to someone not receiving assistance often rents for less than the payment standard.[xvi] This happens because metro-level FMRs are based on large geographies that experience increasingly higher rents that outpace FMRs. Within these geographies are housing submarkets that, through their own neighborhood characteristics, have greater variations in rental costs between them.
HUD’s rent reasonableness test – guidelines offered to public housing authorities to prevent overpayment for similar sized units – attempts to limit the extent that vouchers are used to overpay for units in low-opportunity neighborhoods. While research indicates that voucher units are overcharged relative to unassisted units, the data does not account for renovated units in these areas, which are often rented at higher prices than mean local rents. Past research examining the effects of adopting a Small Area Fair Market Rent standard instead found a net decrease in overpayments.[xvii] Below is a note from HABC payment standard chart regarding rent reasonableness.
“The Payment Standard is not the rent amount that can be requested for a prospective unit. The Payment Standard is used as a guide by HABC in determining if the rent requested by the Landlord is reasonable. HABC compares the requested rent amount to rents for similar unassisted units in the marketplace, and then compares rents for similar units on the premises.”
Researchers have examined this dynamic of voucher holders clustering in low-opportunity neighborhoods rather than opting for an affordable unit in a high-opportunity neighborhood. Eva Rosen in her book The Voucher Promise: Section 8 And The Fate Of An American Neighborhood illustrates what she coins as the “voucher premium” that these neighborhoods offer for landlords. “The ability to collect a higher-than-market rent on a voucher unit is contingent on where the unit is located. In many poor neighborhoods where it is difficult to attract tenants, landlords are obliged to lower their asking rents for market-rate tenants in order to fill units and accommodate the incomes of the local population. The voucher rents are based on FMR for a much larger geographic area and may indeed be higher than other similar houses on the block or in the neighborhood. Therefore, a landlord can often earn more rent by finding a voucher tenant than by renting through the open market.” When considering the burden voucher holders have to find a unit that fulfills their needs, the lack of affordable housing, and the incentive for property owners to rent units in low-income neighborhoods to voucher tenants due to rent ceiling, the clustering of voucher holders in areas where there are many of them appears more of a systemic byproduct of the program. Rosen’s research drew from her field work in Baltimore City and in neighborhoods like Park Heights.
While the landlord ultimately accepts or rejects the voucher, Rosen states that they are working within a system. “Voucher specialists,” as she refers to them, “acquire units in clusters, renovate them at the same time, advertise in the same way, and even set up inspections for the same day when possible.” These tend to be units in affordable, but declining neighborhoods.
“Because of the way rent ceilings are set, only the bottom half of the distribution of homes are available for tenants to rent at all. The available homes tend to be in higher-poverty neighborhoods,” Rosen states. “When landlords with affordable homes in affluent neighborhoods opt out of the program and those in disadvantaged neighborhoods opt in, they compound the problems that limited supply of affordable housing causes, further circumscribing voucher tenants’ options.”
Access to higher-opportunity neighborhoods is the end goal of the Housing Choice Voucher program, facilitating the upward mobility of low-income residents through the private rental market. Yet in Baltimore City, most housing voucher recipients cluster in low- to middle-income neighborhoods. While families may choose a neighborhood for a variety of reasons, the affordability some neighborhoods offer is a key attraction, despite their possible lacking in other aspects such as access to good schools, jobs, and transportation. If the program’s intentions were to facilitate the movement of low-income, cost-burdened families into more stable affordable housing, why aren’t voucher recipients moving to higher-opportunity neighborhoods? Higher-opportunity neighborhoods rent at a rate higher than the fair market rent that HABC sets. So how could these voucher holders make it to these areas?
Finding housing through a voucher can have steep obstacles when assessing whether a unit or neighborhood can match the family’s needs. The city has an aging housing stock that makes safe, realistic housing options scarce. This is a disadvantage for many recipients who have children and desire bigger spaces, safer neighborhoods, better transportation, and good schools.
Small Area Fair Market Rent
In 2016, HUD updated their guidance for calculating payment standards titled Small Area Fair Market Rent (SAFMRs). SAFMRs take the Fair Market Rents at the ZIP code level rather than the metro statistical area (MSA). The formula uses the Fair Market Rent for the Baltimore Metro Area and applies a weight to set the payment standard for different ZIP codes in the city. Based on the payment schedule, the voucher would be worth more in high-opportunity areas, like Federal-Hill, Mount Washington, and Fells Point, and less in low-income areas, like Edmondson Village and Belair-Edison.[xviii]
HABC currently uses rents from the 50th percentile fair market rents from the Baltimore-Columbia-Towson metro area, then adjusts it to 110% of the FMR to set payment standards. Adjusting how HABC calculates payment standards could lead to vouchers covering more rent in a higher-opportunity neighborhood. SAFMR would allow for local, neighborhood housing market conditions to dictate voucher values, rather than a metro area. This would support both people and place-based initiatives to reduce concentrations of housing choice vouchers.
Research on housing choice voucher rent ceilings suggest that policies that make vouchers more generous across a metro area, such as broad increases in payment standards, benefit landlords that opt in the program for the potential earnings and can increase rents in housing submarkets, with minimal impact on neighborhood and unit quality. A second policy that indexes rent ceilings to neighborhood rents, allowing for localized factors and neighborhood characteristics, leads voucher holders to move into higher-quality neighborhoods, according to research on SAFMR.[xix]
When the FMR is defined at the ZIP code level rather than at the metropolitan level, voucher holders have more money to spend in more affluent neighborhoods, allowing them to move to such communities. In addition, lowering rental payments in disadvantaged neighborhoods eliminates the “voucher premium,” removing the financial incentive for landlords to rent near or at the rent ceiling. And by raising rental payments in higher-income neighborhoods, SAFMR can, in theory, recruit new landlords in new neighborhoods, as well as provide voucher households with more choice and access to those neighborhoods. This has important implications for both the cost-effectiveness of voucher administration as well as for mobility outcomes. If the local housing authority has adequate funds, this could allow them to allocate more vouchers in more affluent areas. If funds are inadequate, a housing authority may find it difficult to place voucher holders in higher-opportunity neighborhoods without reducing the total number of voucher holders.
Additionally, HUD announced a policy change in 2022 to better adjust FMRs in the Housing Choice Voucher program to keep pace with rapidly rising market rents. For the first time, HUD will use up-to-date private rent data to help set FMRs. This ensures that FMRs better reflect housing costs in local communities and allows, where needed, higher subsidies that can make it easier for families to find housing with their voucher.[xx]
This new policy will help ensure that voucher subsidies are adequate to rent good-quality housing in a range of neighborhoods but not higher than needed, which would reduce the number of families agencies can assist with the limited funds available to them. If FMRs and payment standards are too low, however, some voucher holders may not be able to use their vouchers. Inadequate FMRs shrink the pool of available units for which market rent falls below the payment standard. This creates more administrative work for renters, who may need to search longer and apply to far more units. Lengthy housing searches are especially burdensome for people who are already unhoused and may be living in a shelter, car, or hotel. In the worst cases, some renters fail to find any housing in the time allotted and must return the voucher to the housing authority. Losing their housing assistance can put these renters at risk of homelessness, eviction, and other hardship.
HUD’s new policy is intended to set FMRs for 2023 that better reflect recent increases in market rents. Under the policy, HUD will use private rent data from six companies (including Zillow and Apartment List) to supplement the public data sources it used in the past. Those private sources include recent data on newly rented units, so including them in HUD’s calculations makes FMRs more responsive to recent rent increases. The impact varies from one region to another, but overall the 2023 FMRs are 10 percent higher on average than the 2022 FMRs — a major increase that can be expected to make it much easier for many voucher holders to rent homes that meet their needs. While this greatly impacts HUD’s ability to accurately calculate FMRs, HUD is unsure of its ability to use private data going forward. The result is ultimately that FMRs will lag behind rapidly rising rents and growing unaffordability for voucher holders regardless of income.
SAFMR Findings
In Baltimore City, where neighborhoods vary in characteristics, implementing SAFMR would have varying effects and implications on the access to opportunity for voucher recipients. Below is a table showing the difference between FMRs and SAFMR by bed size, using 2022 data[xxi].
Table 3: Comparison of 50th percentile FMR vs 40th percentile SAFMR October 2022 Data
| Unit Size | 50th percentile
FMR |
110% of FMR | SAFMR ≥ FMR
(6 out of 36 ZCTA)[xxii] |
SAFMR
90% of FMR (5 out of 36 ZCTA)[xxiii] |
SAFMR < 90% of FMR
(Remaining ZCTA) |
| 0 | $1,173 | $1,290 | $1,180 – $1,290 | $1,080 – $1,170 | $860 – $1,020 |
| 1 | $1,359 | $1,494 | $1,370 – $1,490 | $1,250 – $1,350 | $1,020 – $1,180 |
| 2 | $1,678 | $1,845 | $1,690 – $1,840 | $1,540 – $1,670 | $1,260 – $1460 |
| 3 | $2,177 | $2,394 | $2,190 – $2,390 | $2,000 – $2,170 | $1,630 – $1,890 |
| 4 | $2,491 | $2,740 | $2,510 – $2,730 | $2,290 – $2,480 | $1,870 – $$2,170 |
| 5 | $2,864 | $3,150 | – | – | – |
| 6 | $3,238 | $3,561 | – | – | – |
| 7 | $3,611 | $3,972 | – | – | – |
Additionally, many ZIP codes in Baltimore City encompass areas that vary drastically in characteristics (see ZIP code 21202 in Map B below). This illustrates the potential voucher holders have in moving to higher opportunity neighborhoods, but also the potential for their voucher to become less adequate to keep them in their current housing situation. Below is a map from the Baltimore Regional Housing Partnership of the areas considered low- and high-opportunity by ZIP codes that SAFMR would impact.[xxiv]
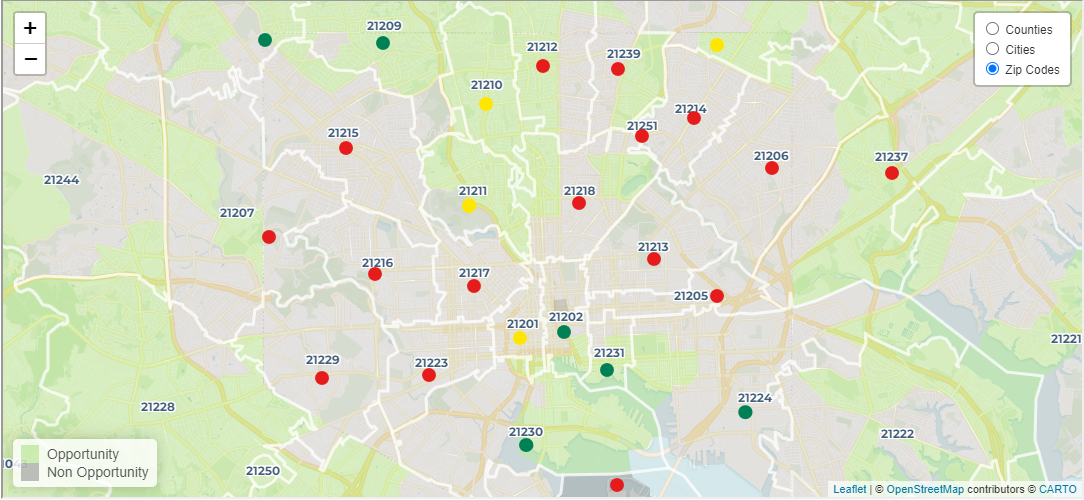
Map D: SAFMR impacts for Baltimore City Zip Codes via BRHP opportunity index map[xxv]
Explore the full Baltimore Metro Area housing landscape data tool
Additional research on implementing SAFMR in areas with varying neighborhood characteristics and urban design highlights the potential outcomes for voucher recipients. In Dallas, researchers examined two policies and their effects on rent and neighborhood quality: broadly raising FMRs or basing FMRs on ZIP codes (SAFMR). They found that increasing the rent ceiling uniformly by $1 raises voucher rents by roughly $0.46 with no commensurate improvements in housing or neighborhood quality, while tilting the rent ceiling to ZIP codes caused voucher families to move to safer and less impoverished neighborhoods at zero net cost to the government. Although tilting the rent ceiling is highly cost-effective and may allow voucher holders to move to better neighborhoods, the destination neighborhoods are still of a relatively low quality relative to the distribution for Dallas as a whole, and may have barriers mentioned above which could explain this.[xxvi]
Further research, specifically the introduction of the SAFMR rent calculations, resulted in voucher households living in higher-opportunity neighborhoods in Dallas, Texas; in lower opportunity neighborhoods in Chattanooga, Tennessee; and mixed effects in other areas.[xxvii] In Chattanooga, much of the rental stock in Chattanooga was already in ZIP codes that were accessible with the traditional FMR calculation prior to the policy being in place, meaning that applying the SAFMR approach may not have increased a voucher household’s options all that much. What this means is that, if a high proportion of neighborhoods are within 10% of FMR, voucher holders found little reason to move. The rental stock of the local area matters as well. Regardless of the prevailing voucher rent limit, affordable rental options in low-income neighborhoods are what is most available to voucher recipients.
Baltimore, while dissimilar to Chattanooga in many ways, presents a similar situation in that, currently, many of its affordable units are situated in areas considered low-opportunity.[xxviii] It seems to reason that using a SAFMR payment standard will decrease the rents paid for voucher units with any specified set of characteristics in the low-opportunity neighborhoods and will increase the rents of such units in the high-opportunity neighborhoods.[xxix] Public housing authorities have mechanisms in place to prevent payment standards decreasing below 90% of FRM in these neighborhoods.[xxx] So, in theory, rents could be reduced to a point that does not hamper voucher holders’ ability to stay in their current units, while potentially saving funds to increase access to opportunity or create more vouchers for additional families in need.
One study estimated that increasing availability of units in high-opportunity neighborhoods may not work as intended, particularly for Black and Hispanic voucher recipients. This is because voucher holders often face barriers due to racial segregation and discrimination, particularly in accessing high-opportunity neighborhoods. These factors may discourage Black and Hispanic voucher holders from moving into high-opportunity neighborhoods. Since most of those neighborhoods are predominately white, Black and Hispanic voucher recipients may potentially opt out of those areas. Furthermore, SAFMR may make it difficult for voucher recipients to find eligible units due to a decline in the number of units (based on reduced rent ceiling) where many voucher holders currently reside, particularly areas where voucher holders cluster[xxxi].
Two studies examined the switch from metro-wide FMRs to SAFMR using Zillow and Craigslist rental advertisements. While not a perfect measure of rents, these websites offer a look into rental submarkets of metro regions. Examining the effects of SAFMR on rental prices using Craigslist housing listings in non-rule areas (areas not required to use SAFMR), the study found that when comparing listings above and below FMRs, the Baltimore-Columbia-Towson metro-statistical area (MSA) saw a net 15% increase in listings covered by SAFMR vouchers. Based on the study’s methodology, Small Area Fair Market Rents were more aligned with what tenants could demand in a housing submarket.[xxxii] Listings on Zillow in the 24 metro areas that adopted SAFMR yielded the same results, with only one metro area seeing a net decrease.[xxxiii] Switching to SAFMR can lead to a boost in listings covered by the voucher, though they note certain safeguards that must be considered, such as limiting the drop of affordable housing in low-opportunity areas. Based on their analyses, more areas should consider switching to forms of setting payment standards that account for, and minimize, neighborhood submarket variation.
Policy Implications
Public housing authorities are equipped with mechanisms to adjust payment standards, such as setting payments above FMR if area rents are outpacing payment standards. In 2019, HABC broadly increased vouchers to up to 110% of FMR. Certain census tracts within Baltimore City, however, go for above this amount, at between 110% – 135% of FMR. HABC sets these payment standards by taking the median gross rents of these specific census tracts. Using median rents at the census level captures granular differences between housing submarkets, but it’s unclear whether there are limitations to applying this at a regional scale. PHA’s should review setting payment standards at the census track level as the implications from adopting SAFMR suggest increased voucher affordability and stability of local housing markets, possible more then the adoption of SAFRMs. SAFMR can capture these local factors but have potentially harmful outcomes for voucher holders currently living in low-income communities.
HUD’s ruling established several ways of protecting these families in low-rent ZIP codes.[xxxiv] First, by limiting FMR declines to no more than 10 percent per year, which means in each future year, the SAFMR will be no lower than 90 percent of the previous year’s SAFMR. In the lowest-rent neighborhoods, SAFMRs will therefore phase down gradually rather than dropping abruptly. Second, they can delay the impact of lower payment standards on families that choose to remain in these areas. They can do this in one of four ways:
- Maintain the regular practice of applying reductions at the second annual review, which gives families one to two years of notice before the new payment standard goes into effect;
- Phase the payment standard reduction in gradually, for example by applying a 15% payment standard reduction in three increments of 5% per year (with the first part of the reduction going into effect no sooner than the second annual review);
- Permanently hold families harmless by continuing to use the previous, higher payment standard for as long as a family remains in the same unit;
- Applying a portion of the reduction and then holding families harmless after that, for example by applying only 5 percentage points of a 15% reduction (again no sooner than the second annual review).
PHAs must include in their administrative plans the policies they plan to follow to implement reduced payment standards if they adopt SAFMR. They are allowed to update administrative changes after changes go into effect to address unforeseen cases. In addition, they are required to notify voucher holders whose current payment standard is set to decline at least 12 months before they will be affected, so they can plan ahead and potentially move.
Agencies can adopt different policies for different portions of their service areas. For example, an agency could apply reductions at the second annual review in most ZIP codes but institute a permanent hold-harmless in neighborhoods where market rents are rising rapidly and are expected to soon surpass the SAFMR. Agencies must, however, use the same policy for all households in a particular geographic area. For example, they are not permitted to adopt a hold-harmless for all elderly and disabled households in a specified ZIP code, but not for other households in the same ZIP code. They may provide exception payment standards up to 120% of the SAFMR when needed to, such as to enable people with disabilities to rent suitable housing — including in cases where families need such exceptions to remain in their current homes.
While these mechanisms give PHAs power in deciding how they allocate resources, policymakers must consider more significant policy changes.[xxxv] These include, but are not limited to:
- Addressing the insufficient supply of vouchers and funding the voucher program at adequate levels.
- Review setting payment standards at the census track level.
- Expanding SAFMR rule to additional non-rule PHAs that will benefit.
- Addressing widespread housing discrimination against families with vouchers by expanding source of income laws to the federal level.
- Increasing voucher search times.
- Assisting families with security deposits, applications, and other administrative barriers to high-opportunity neighborhoods either through government funding or PHA administration.
- Eliminating restrictions and barriers to PHA jurisdictions. Multiple PHAs serving the same regional housing market should consider consolidating, allowing for vouchers to be portable across a larger region.
- Reforming landlord listings and other tenant information systems.
Conclusion
It is hard to fully predict the long-term outcome of implementing SAFMR in Baltimore City. While the payment standards would be higher than current FMR in certain wealthier neighborhoods, it’s difficult to predict if this would encourage voucher holders to move to these areas. Landlords in high-opportunity areas may find new incentives to participate in the voucher program due to the higher rent ceiling, but a majority of current voucher landlords operate in low-opportunity areas, and it remains to be seen if new landlords would opt in. Factors like the COVID-19 pandemic could have also prevented movement, particularly with many voucher holders being seniors.
Additionally, HABC raised payment standards up to 135% in 2022 in a few census tracts that could improve voucher holders’ ability to move to higher-opportunity neighborhoods. Furthermore, PHAs are responsible for setting their payment standards no lower than 90% of FMR. Should the Baltimore-Columbia-Towson region implement SAFMR with this rent floor, the total amount of affordable units increases across the region, and it is reasonable to expect that SAFMR would increase affordable housing options for voucher holders in Baltimore City.
By setting fair market rents at a more granular level, neighborhood characteristics are more apparent when setting rent ceilings. Our map used census tract level data to illustrate the relationship between housing choice voucher use and rental affordability. At the ZIP code level, as shown by Map B, the dynamics of where voucher holders cluster and what types of rental units in opportunity areas they can afford holds true. SAFMR provides a pathway to provide voucher holders with rent ceilings that will allow them to move to improve their quality of life. It can also, however, potentially reduce funds for voucher holders living in low-income areas that choose to do so if the housing authority doesn’t provide safeguards.
The cost effectiveness of SAFMR provides an opportunity for PHAs to allocate additional vouchers for families. If voucher holders deconcentrate from low-income neighborhoods, rents could become less inflated, which would also relieve market pressure on unassisted renters. PHAs should consider implementing SAFMR and monitor while implementing policies to avoid unintended consequences.
Baltimore, like many American cities, is facing an affordable housing crisis that limits the places and spaces that many low-income people can access. While there’s no doubt the voucher program has aided many low-income families, there are many more in need of assistance, particularly in Baltimore where the average wait for a voucher is 14 months. Additionally, vouchers are not a silver bullet to the issues of affordable housing, but implementing policies that factor in neighborhood characteristics can allow for greater choice in where people live. Whether those benefits are realized, however, will depend on the actions PHA and those involved in the Housing Choice Voucher program take to implement the new tools and help families make the most of the opportunities they offer.
SAFMR has shown itself to be successful and, in many cases, increases access to opportunity and helps families move out of poverty. However, it is not guaranteed that voucher holders can overcome systemic boundaries to high-opportunity neighborhoods. Policymakers must create effective safeguards against discrimination and effective fiscal policy to help voucher holders.
Methodology & Limitations
Data & Demographics
We created a data tool, an interactive map and dashboard (ArcGIS Online) to display data indicators by Census Tract, showing spatial disparities in locations of voucher use as it relates to other demographic and housing characteristics. We used a bivariate choropleth map to show relationship between voucher use and rental affordability as well as a hatched overlay to show Tracts that are below the AMI. Our key questions were:
- Who would benefit from SAFMRs and where are they located?
- And then, what could this mean for policy recommendations?
- How are the data factors related?
Exploratory data to enable a variety of audiences to learn more about the indicators and geographic areas. Zoom in functions that display data for familiar zip codes and counties. Large focus on relationships:
- American Community Survey 5-Year Estimates, 2017-2021
- Race/ethnicity data
- Median household income
- Gross rent
- Rental affordability (percent spending > 30% of income on housing costs)
- Number of housing choice vouchers divided by total renters (ACS)
- Area median income – AMI
- MdProperty View (Maryland Department of Planning) for owner-occupancy
- RBIntel for Cash sales of residential properties
Limitations
- We interviewed four stakeholders familiar with the Housing Choice Voucher Program and one voucher holder.
- We were unable to interview landlords that rent to voucher holders.
- We were unable to note the specific census tracts that have rent ceilings at 135% of FMR. Based on census tracts at 110%-120% of FMR, there are possibly several census tracts that have this rent ceiling.
Appendix
Census Tracts @ 115% of FMR (Census: 2715 & 2720)
| Unit Size | FMRs | 115% |
| 0 | $1,173 | $1,348 |
| 1 | $1,359 | $1,562 |
| 2 | $1,678 | $1,929 |
| 3 | $2,177 | $2,503 |
| 4 | $2,491 | $2,864 |
| 5 | $2,864 | $3,293 |
| 6 | $3,238 | $3,723 |
| 7 | $3,611 | $4,152 |
Census Tracts @ 120% of FMR (Census: 2713, 2714 & 2715.03)
| Unit Size | FMRs | 120% |
| 0 | $1,173 | $1,407 |
| 1 | $1,359 | $1,630 |
| 2 | $1,678 | $2,013 |
| 3 | $2,177 | $2,612 |
| 4 | $2,491 | $2,989 |
| 5 | $2,864 | $3,436 |
| 6 | $3,238 | $3,885 |
| 7 | $3,611 | $4,333 |
Notes
[i] OUT OF REACH 2022: NATIONAL LOW INCOME HOUSING COALITION: https://www.google.com/url?q=https://nlihc.org/sites/default/files/oor/Maryland_2022_OOR.pdf&sa=D&source=docs&ust=1684382346457143&usg=AOvVaw17j-yw_4wsdEizIaD3Ry7Z
[ii] Baltimore Community Change 2010-2020: https://communitychange-bniajfi.hub.arcgis.com/apps/859eac5cf5c94c6c94ace31dd2c41853/explore
[iii]Long Waitlists for Housing Vouchers Show Pressing Unmet Need for Assistance https://www.cbpp.org/research/housing/long-waitlists-for-housing-vouchers-show-pressing-unmet-need-for-assistance
[iv]Where Families With Children Use Housing Vouchers
https://www.cbpp.org/research/housing/where-families-with-children-use-housing-vouchers
[v] HOW HAVE BALTIMORE’S COMMUNITIES ENSURED HOUSING DIVERSITY?
https://communitychange-bniajfi.hub.arcgis.com/apps/859eac5cf5c94c6c94ace31dd2c41853/explore
[vi] Rate of Housing Vouchers per 1,000 Rental Units
https://bniajfi.org/indicators/Housing%20and%20Community%20Development/hcvhouse/2020
[vii] Affordability Index – Rent
https://bniajfi.org/indicators/Housing%20and%20Community%20Development/affordr
[viii] The Housing Authority of Baltimore City uses 50th percentile rents, which take the FMRs at the 50th percentile, rather than the issued 40th percentile FMRs.
[ix] In 2019, HABC increased payment standards across all census tracts in the city to 110% of 50th percentile FMRs)
[x] See appendix for additional tables
[xi] Percentage of Housing Units that are Owner-Occupied
https://bniajfi.org/indicators/Housing%20and%20Community%20Development/ownroc
[xii] See methodology for indicators
[xiii] https://data.census.gov/
[xiv] In certain census tracts, the median rent is as high as $1,500.
[xv] Baltimore City Council Bill 18-0308 “An Ordinance Concerning Housing Discrimination – Source of Income” was signed by the Mayor on April 15, 2019.
[xvi] Are Landlords Overcharging Housing Voucher Holders? https://scholar.harvard.edu/files/mdesmond/files/desmondperkins.cc_.2016.pdf
[xvii] Olsen, E. O. (2019). Does HUD Overpay for Voucher Units, and Will SAFMRs Reduce the Overpayment? Cityscape, 21(3), 89–102. https://www.jstor.org/stable/26820649
[xviii]Implementing Small Area Fair Market Rents (SAFMRs) https://files.hudexchange.info/resources/documents/SAFMRs-Implementing-Small-Area-Fair-Market-Rents-Implementation-Guidebook.pdf
[xix] Collinson, Robert, and Peter Ganong. 2018. “How Do Changes in Housing Voucher Design Affect Rent and Neighborhood Quality?” American Economic Journal: Economic Policy, 10 (2): 62-89.
[xx] New HUD “Fair Market Rent” Policy Can Help Local Agencies Reduce Homelessness and Expand Housing Choice https://www.cbpp.org/sites/default/files/9-28-22hous.pdf
[xxi] Dataset/Small Area Fair Market Rents
https://www.huduser.gov/portal/datasets/fmr/smallarea/index.html#2023_data
[xxii] 21231, 21230, 21208, 21224, 21202, 21209
[xxiii] 21201, 21228, 21236, 21211, 21210
[xxiv] https://brhp.org/opportunity-areas/
[xxv] note: not all zip codes referenced. Some zips are located in unusual areas within zip codes. Some of these zip codes see decreases in rent ceilings, but are in areas seeing an increase in rent ceilings i.e., 21231
[xxvi] Collinson, Robert, and Peter Ganong. 2018. “How Do Changes in Housing Voucher Design Affect Rent and Neighborhood Quality?” American Economic Journal: Economic Policy, 10 (2): 62-89.
[xxvii] Vincent Reina, Arthur Acolin & Raphael W. Bostic (2019) Section 8 Vouchers and Rent Limits: Do Small Area Fair Market Rent Limits Increase Access to Opportunity Neighborhoods? An Early Evaluation, Housing Policy Debate, 29:1, 44-61, DOI: 10.1080/10511482.2018.1476897
[xxviii] https://www.cbpp.org/research/housing/where-families-with-children-use-housing-vouchers
[xxix] Olsen, E. O. (2019). Does HUD Overpay for Voucher Units, and Will SAFMRs Reduce the Overpayment? Cityscape, 21(3), 89–102. https://www.jstor.org/stable/26820649
[xxx]https://www.hud.gov/sites/documents/HOTMA_DRAFT.PDF
[xxxi] McClure, K., & Schwartz, A. (2019). Small Area Fair Market Rents, Race, and Neighborhood Opportunity. Cityscape, 21(3), 49–70. https://www.jstor.org/stable/26820647
[xxxii] Olsen, A. (2019). Examining the Transition to HUD Small Area Fair Market Rents Using Craigslist Data. Cityscape, 21(3), 207–244. https://www.jstor.org/stable/26820655
[xxxiii] Casey, A. (2019). A Tweak to Housing Assistance Allows Low-Income Renters Access to High-Income Neighborhoods. Cityscape, 21(3), 245–258. https://www.jstor.org/stable/26820656
[xxxiv] https://www.cbpp.org/sites/default/files/atoms/files/5-4-18hous.pdf
[xxxv] Tegeler, P. (2020). Housing Choice Voucher Reform: A Primer for 2021 and Beyond. Poverty & Race Research Action Council. http://www.jstor.org/stable/resrep27276