Immigrants in the Maryland Economy: Overcoming Hurdles, Yet Still Facing Barriers
MDCEP is releasing this report in partnership with the Immigration Research Initiative. Anthony Capote and David Dyssegaard Kallick of IRI co-authored the report, with Maryland data research and analysis by MDCEP State Policy Fellow Jasmin Aramburu.
There are over 940,000 immigrants living in Maryland. Making up 15% of the state’s population, immigrants are a vital part of the social, economic, and cultural life of all Maryland communities.[1]
The economic role of immigrants has frequently been misunderstood. On the one hand, immigrants are a big and important part of the state’s economy. And, on the other hand, immigrants are disproportionately concentrated in low-wage jobs.
- Immigrants account for 19 % of the state economic output (GDP), even higher than their share of the population.[2] Maryland has a $438 billion economy, according to the Bureau of Economic Analysis 2021 statistics, which means immigrants are conservatively responsible for $83 billion of economic output.[3]
- A key reason for this high share of economic output is that immigrants are concentrated in prime working age. In Maryland, while immigrants make up 15% of the population, they make up 19% of the working-age population (ages 16 to 64), and a corresponding 20% of the labor force.
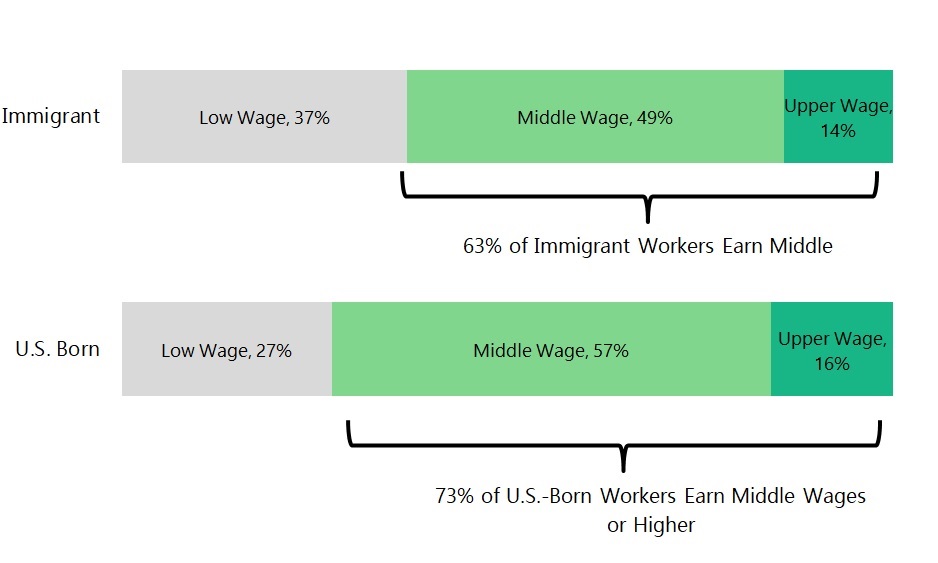
- Immigrants work in jobs across the economic spectrum. A common misperception is that when we are talking about immigrants we are talking mostly about people in low-wage work. Yet, looking at all immigrant workers—documented and undocumented—63% of those with full-time jobs earn at least $43,000 per year, which is a middle wage for full-time work in the state.
- While most immigrants are in middle- or upper-wage jobs, immigrants are at the same time disproportionately likely to be in low-wage jobs. In all, 37% of immigrants are in jobs paying under $43,000, compared to 27% of U.S.-born workers.
- Race and gender are as much a factor as nativity in wage outcomes for workers. Men have higher wages than women. And people who are white have considerably higher wages than Black or Latinx workers, whether they are U.S.-born or immigrants.
- In low-wage occupations, more half (63%) work in service or construction jobs, such as building cleaners, construction laborers, or housekeepers. The pandemic highlighted the importance of many of these jobs to America’s daily life that are often underappreciated or invisible. There is little doubt that the 168,000[4] undocumented immigrants estimated to be in the labor force are overwhelmingly in these low-wage occupations.
- Among middle-wage occupations, immigrants are spread across every sector of the economy. Significant numbers of immigrants work as nurses, software developers, educators, accountants, managers, and much more.
- Among upper wage occupations, immigrants are highly concentrated in a few fields. Fully 73% of immigrants in upper-wage occupations work either in healthcare occupations, or in management and finance occupations. Most are either physicians or computer and information systems managers.
-
Immigrants Work in Jobs Across the Economic Spectrum
For this report, low-wage was defined as earning less than two-thirds the overall median—in Maryland, that means under $43,000. Middle wage was earning between two thirds of the median and double the median, $43,000 to $129,000. And upper wage was earning more than double the median, over $129,000.[5]
The IRI analysis shows that 63% of immigrants in Maryland earn at least a middle wage—49% in the middle wage range and an additional 14% in the upper-wage bracket of $129,000 or more. Among U.S.-born workers, 73% earn at least a middle wage. Among U.S.-born workers, a smaller share are in low-wage jobs, and a larger share in middle-wage jobs compared to immigrants.
The share of immigrants and U.S.-born workers in upper-wage jobs is similar: 14% and 16%, respectively. Indeed, the immigrant share continues to match the U.S.-born share even looking at the top 5% and the top 1% of wage earners. The top 5% of workers are those who earn $193,000 or more per year. The share of both U.S.-born workers and immigrants in Maryland earning over that amount is 4% each. The top 1% of all workers are those who earn $559,000 or more per year, and again 1% of U.S.-born and immigrant workers each fall in this category.
Most workers in the Maryland economy are in jobs that pay over the low-wage level of $43,000 per year. By definition, there will always be some workers in bottom rungs of the economy.
However, two thirds of the median is often considered the poverty wage level around the world, and in some countries very few full-time workers fall below that level.
In Maryland, 27% of U.S.-born workers and 37% of immigrant workers make under two-thirds of the median wage. The immigrants who make up a disproportionate share of this group face numerous barriers in the labor market, from language to educational attainment, recognition of credentials, immigration status or discrimination in the workplace. Of the 684,000 workers in Maryland in low-wage jobs, around 171,000 are immigrants and 513,000 are U.S.-born.
-
Race and Gender Are a Big Factor in Economic Outcomes
Immigrants and U.S.-born residents work in jobs across the economic spectrum, and so do people in all race and gender groups. However, workers are not spread evenly.
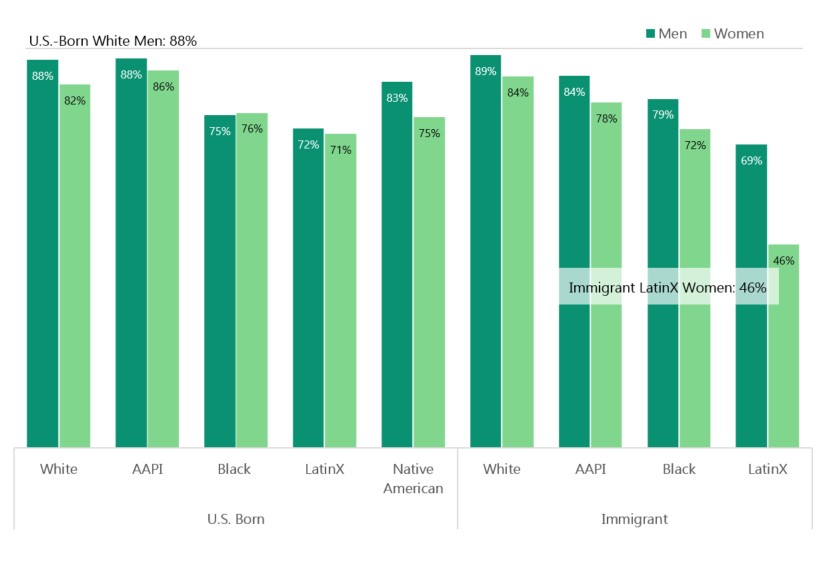
Figure 1 shows that race and gender[6] are significant factors in determining economic outcomes. White and Asian/Pacific Islander men, both U.S.-born and immigrants, are the most likely to earn middle and upper wages. U.S.-born Black workers are far less likely to earn a decent wage for full-time work. The same is true for foreign-born Black women, though not as much for foreign-born Black men.
Hispanic/Latinx[7] immigrants are the group that faces the greatest hardship. The number of Latinx immigrants making low wages highlights the economic struggles of a group of Americans who are often the target of hateful anti-immigrant rhetoric, actions of the U.S. deportation regime, and workplace abuses, as well as barriers they may face due to level of formal education or English language ability. An estimated 69% of Latinx men and a strikingly low 46% of Latinx women born outside the United States make more than the low-wage threshold of $43,000.
Latinx Americans who are U.S. citizens by birth have about the same degree of middle- to upper-wage earnings as U.S.-born Black Americans—far below that of white and Asian workers, but higher than foreign-born Latinx workers. Among U.S.-born Latinx men, 72% make more than $43,000 per year, as do 71% of women.
Among Asian American and Pacific Islanders, a close share of U.S.-born women (86%) and men (88%) earn middle- and upper-wages. About 84% of immigrant AAPI men are in these categories, as are 78% of immigrant AAPI women. Also notable is the large gap in earnings between immigrant Latinx men and women. The share of men making middle- or upper-wages is 13 percentage points higher than for women. This gendered gap in wages is echoed among most other racial-ethnic groups, whether U.S.-born or immigrants.
The Divisions Are Starkest in Upper-Wage Occupations
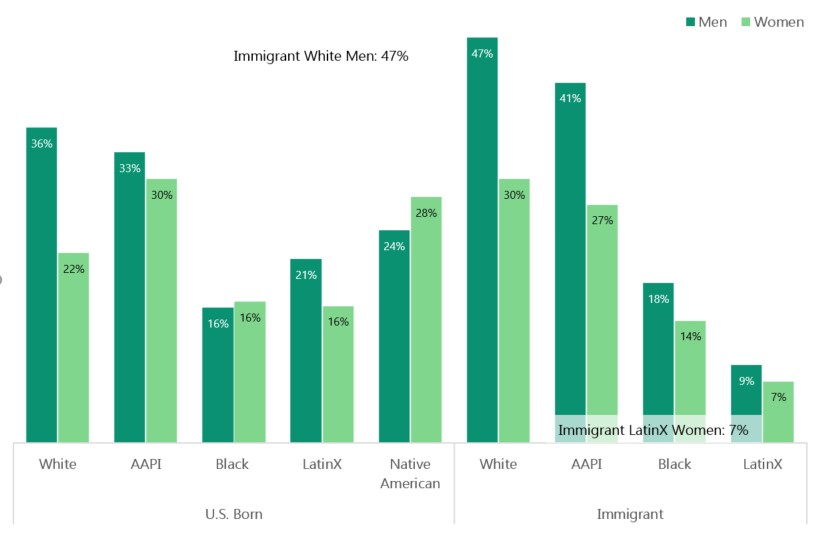
Figure 1 looks at all workers who earned at least $43,000—combining the middle- and upper-wage categories. Figure 2 zooms in to look just at those workers in the upper-wage range, people who earned at least $129,000 between 2016 and 2021.
The economic disparities in the share of people earning upper-wages are even starker. White and AAPI men stand out most significantly, particularly those who are immigrants. Among U.S.-born workers, about one-third of white (36%) and AAPI (33%) men make more than $129,000. Among immigrants, the rates are even higher, with 47% of foreign-born white men and 41% of foreign-born AAPI men earning upper wages. No other groups in our analysis approach this level of concentration in upper-wage jobs.
U.S.-born AAPI and immigrant white women come closest to this level of concentration in the upper-wage category at 30% each, followed by Native American women (28%), immigrant AAPI women (27%), Native American men (24%), U.S.-born white women (22%), and U.S.-born Latinx men (21%). Equal or less than 18% of workers in all other groups earn high wages, including 16% of U.S.-born Black men and women, 14% of immigrant Black women, 9% of immigrant Latinx men, and 7% of immigrant Latinx women who are at the intersection of racial and gender bias, and have the worst economic outcomes overall in the Maryland economy.
Black and Latinx Workers Stuck in Low-Wage Jobs
Working full time and earning under $43,000 per year leaves many workers in every demographic group struggling to make ends meet. There are, however, clear race, gender, and immigration components that contribute to who is mostly likely to be in these low-wage jobs in Maryland.
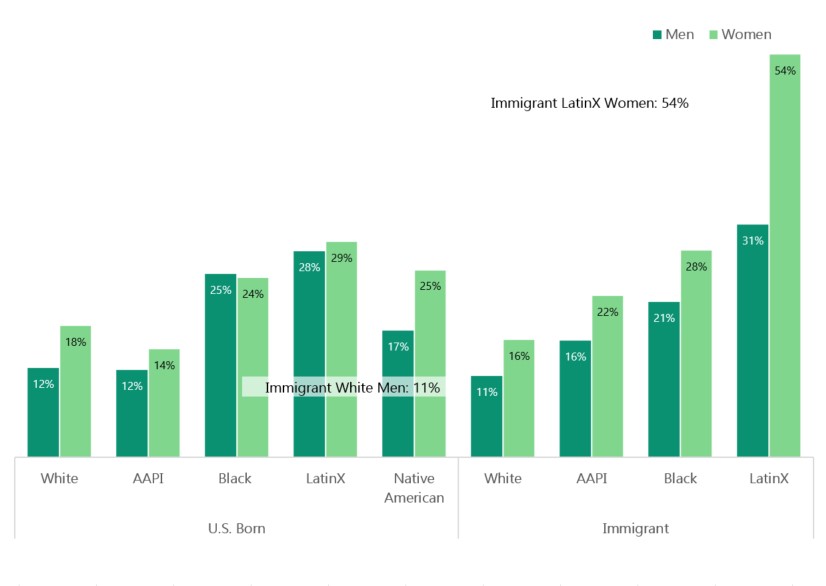
Foreign-born white men (11%) are the least likely to be stuck in low-wage work. Among white people in Maryland, whether immigrants or U.S.-born, the share in middle-wage jobs is between 43 and 61% (not shown in charts). The significant difference among white earners in Maryland is that far fewer white women earn upper wages (between 14 and 17% less than white men regardless of nativity).
The economic disparities in favor of white men are even more pronounced when we consider race as a variable. The percentages of Black, Latinx and Native American men who earn less than $43,000 annually in Maryland are much higher than—and most times double that of—white men, regardless of nativity. For example, between 17 and 28% of U.S.-born men of color earn low wages, as do 12% of U.S.-born white men. Similarly, between 21 and 31 % of foreign-born men are low-wage earners compared to 11% of white immigrant men.
Women of color face even more economic struggles than their male counterparts (Figure 3). U.S.-born Black, Latinx and Native American women are all more likely to earn low wages and less likely to fall into the upper-wage category. Immigrant women of color, including AAPI women, were even more likely to have lower-wages than U.S. women of color. This was most clear with more than half of Latinx immigrant women being low-wage workers.
Overall, most workers in Maryland are in jobs where they make middle-wages and upper-wages, but there are stark differences among diverse groups. Race, gender, and nativity all stand out as significant factors impacting individuals’ economic outcomes in Maryland. Black and Latinx workers, especially foreign-born Latinx workers, are significantly less likely to earn middle- and upper-wages than other workers. Women are also much less likely than men to make a decent wage. These findings substantiate the wage inequity existing in the state which is experienced by so many women and people of color. Notably, the disparities brought on by systemic racism, class inequality, misogyny, and nativism are clearly quantifiable and surely create barriers limiting individuals’ ability to succeed in the economy.
-
What Low-, Middle-, and Upper-Wage Occupations Look Like
For this analysis we categorize each occupation as either low, middle, or upper-wage using the same criteria as in the previous analysis: low-wage is under $43,000 per year (2/3 of the median), middle-wage is $43,000 to $129,000 (double the median), and upper-wage is above $129,000.[8] Occupations are categorized as low, middle, or upper-wage based on the median wage for immigrants in that occupation.
Low-Wage Work in Maryland
Most immigrants in low-wage occupations are in the service sector. Some 9,300 work as janitors and
| IRI’s Earning Ranges
Immigration Research Initiative used data from American Community Survey’s 2021, 5-year data set to establish our earnings range; the median earning in Maryland is about $65,000. Occupations in which the median wage for immigrants was less than $43,000 were defined as low wage. When the median wage for immigrants was more than $129,000, we defined the job as upper wage. We defined all jobs with a median wage between $35,000 and $129,000 as middle wage. |
building cleaners, with a median wage of $32,000, and 8,200 work as house cleaners, with a median wage of $27,000. Many others work in restaurants, including 7,500 cooks, with a median wage of $26,000, 3,200 waiters earning a median wage of $28,000, and 2,100 food preparation workers, with a median wage of $27,000.
An estimated 33,200 immigrants in low-wage occupations work in the construction and extraction industry, including 13,000 who work as construction laborers with a median wage of $42,000. Another 8,300 work as carpenters, and 5,300 as painters or paperhangers all of whom earn a median between $39,000 and $41,000.
In all, 74,000 immigrants working full-time, year-round are in service occupations, as are 136,000 U.S.-born workers. Immigrants make up 35% of all low-wage service workers, well higher than immigrants’ 20% share of the labor force overall.
There are also many immigrants working in education, legal, community service or arts/media occupations. This includes 2,200 teaching assistants, where the median wage is $33,000, along with 2,000 clergy who make a median wage of $42,000, and preschool and kindergarten teachers with a median wage of $32,000.
There are 17,000 immigrants working in transportation occupations. There are 3,700 immigrants working as taxi drivers, accounting for almost half (48%) of all workers in that occupation, earning a median wage of $27,000. Immigrants work in a range of other transportation jobs as well, including 3,700 immigrants who work as movers and laborers—2,700 stockers and order fillers and an additional 2,100 as packers and packagers. The median wage for immigrants working these jobs—in an industry largely driven by online shopping—is $33,000 for packagers and $27,000 for order fillers.
An additional 12,200 immigrants work low-wage sales jobs, including 4,600 retail salespeople who earn a median wage of $32,000 and 6,100 cashiers with a median wage of $27,000.
It is worth noting that most immigrants in low-wage jobs—63% to be precise—work either in service or construction/extraction jobs.
It is difficult to get precise wage data for undocumented immigrants, but there is little doubt that the large majority work in low-wage jobs, or perhaps slightly above. There are an estimated 168,000 workers who are undocumented in the state labor force, according to estimates from the Center for Migration Studies, with a high percentage of them year-round, full-time workers. As a rough estimate, undocumented immigrants may make up around half of all low-wage workers who are immigrants. Among workers who are undocumented, over one-third work in services jobs, 29% in construction, maintenance, and related jobs, 14% in managerial and professional specialty occupations, 12% in production, transportation or moving jobs, and 11% in technical, sales, and administrative support.
Finding Space in the Middle
Immigrants in middle-wage occupations work in a very wide array of positions: nurses, software developers, educators, managers, and more.
The single most common occupation for immigrants in this middle-wage category is managers. There are 41,500 immigrants in Maryland who work as managers in a broad range of fields. In fact, 15% of all managers in Maryland are immigrants. Some common managerial jobs for immigrants include construction managers, financial managers, and food service managers. The median wage for immigrants who work as construction systems managers—of which there are 3,100—is $66,000, compared to $97,000 for 4,500 financial managers, and $50,000 for 4,600 food service managers.
Other popular occupations for the middle-wage sector include computer, engineering and science occupations. There are over 11,200 immigrant software developers with a higher median wage of $121,000, and make up 26% of all software developers who earn middle-wages in the state. Additionally, immigrants account for almost half (45%) of physical scientists and earn a median salary of $95,000. Immigrants make up 19% (or 12,200 workers) of all engineers and architects with middle-wages in the state.
There are several middle-wage education occupations as well. Around 15,500 immigrants work as educators, accounting for 15% of all educators in the state. While immigrants are extremely underrepresented among educators overall, it is worth noting that immigrants are a disproportionately high share (30%) of college professors compared to elementary or middle school teachers (10%). There are around 6,000 postsecondary immigrant teachers, earning a median wage of $94,000.
Immigrants also play a vital role at all levels of the healthcare sector. In terms of middle-wage health care occupations, there are 14,300 immigrants working as registered nurses, with a median wage of $81,000 making up 28 % of all workers in that occupation. There are also 7,600 healthcare technicians and assistants, including 2,700 licensed vocational nurses making a median wage of $50,000, and 1,500 lab technicians with a median wage of $60,000.
Another 10,300 immigrants work as retail and sales supervisors (18% of the total), and 4,300 work as salespeople in a range of industries. This includes 1,300 wholesalers with a median wage of $63,000, 1,100 real estate brokers who earn a median wage of $73,000, and 1,100 service sales agents, for whom the median wage is $81,000.
Immigrants in Maryland account for 3,300 community and social service staff (15% of the total), 1,600 counselors (11%), 1,400 artistic designers (11%), and 1,000 legal workers such as paralegals (9%). Median wages range from $44,000 (for social service assistants) to $112,200 (for rehabilitation counselors).
While many immigrants who work in construction are in low-wage jobs, there are also significant numbers in middle-wage construction jobs in the trades, in specialized jobs, or as supervisors. There are over 4,100 construction supervisors who are immigrants, making up 30 % of all supervisors in construction, along with 3,300 electricians (19% of total), and 2,800 plumbers (22%). The median wage for immigrants in the construction trades ranges from $44,000 for plumbers to $48,000 for electricians. While immigrants play a significant role in many construction jobs, U.S.-born workers—often with more established networks, experience on the job, and English-language skills—have been more likely to be construction supervisors.
Immigrants in Upper-Wage Jobs
In Maryland, upper-wage occupations are those with a median income of about $129,000 or higher, more than double the overall median wage for full-time workers.
Of the 23,000 immigrants working upper-wage occupations in the state, 41% or 9,200 individuals, work in healthcare occupations. In fact, immigrants make up 32% of all upper-wage healthcare jobs, mostly physicians or pharmacists, contributing to the overall wellbeing of all Americans. Moreover, immigrants make up 42% of all pharmacists in the upper-wage bracket, 34% of dentists, and 31% of physicians. The median wage for immigrant physicians is $216,000, and for pharmacists it is $136,000. An additional one-third of immigrants who work in upper-wage jobs work in the management, business and financial sector. These include computer and information systems managers, chief executives, or architectural and engineering managers, whose median earnings range from $137,000 to $153,000.
About the Authors
Anthony Capote
Antony Capote is a senior policy analyst at Immigration Research Initiative, a nonprofit, nonpartisan think tank that looks at immigration issues.
David Dyssegaard Kallick
David Dyssegaard Kallick is director of Immigration Research Initiative.
Jasmin Aramburu
Jasmin Aramburu is a State Policy Fellow with the Maryland Center on Economic Policy.
Notes
[1] All data in this report are Immigration Research Initiative analysis based on the 2021 American Community Survey 5-year data. Immigrants here are defined as people born in another country and living in the United States, whatever their immigration status. “Immigrants” includes refugees, asylees, people with green cards, naturalized citizens, people with temporary visas, and immigrants who are undocumented.
[2] We measure economic output as the immigrant share of total earnings, on the assumption that people are paid in proportion to their economic contribution. In the case of immigrants, and indeed for most workers, this is a conservative estimate since workers are often paid less than a fair share of economic output. Bureau of Economic Analysis shows Maryland State GDP to be $438 billion in 2021.
[3] We measure economic output as the immigrant share of total earnings, on the assumption that people are paid in proportion to their economic contribution. In the case of immigrants, and indeed for most workers, this is a conservative estimate since workers are often paid less than a fair share of economic output. Bureau of Economic Analysis shows Maryland GDP to be $438 billion in 2021.
[4] Estimate from the Center for Migration Studies.
[5] These wage brackets are based on full-time (at least 35 hours/week), year-round (at least 50 weeks/year) wage and salary earnings, or farm or business income. The threshold for middle-earners is extrapolated from the common practice of defining middle class as between two-thirds and twice the median household or family income. See, for instance, the middle-class calculator of the Pew Research Center. To get a better picture of individual workers, IRI looks at a worker’s earnings rather than household or family income.
[6] While IRI and MDCEP recognize that gender is not binary and that not all Americans are either men or women, the American Community Survey and U.S. Census Bureau only account for two genders.
[7] In this analysis, white refers to non-Hispanic/Latinx white, Black to non-Hispanic/Latinx Black, Asian to non-Hispanic/Latinx Asian American and Pacific Islanders—sometimes shortened to AAPI or to “Asian,” and Hispanic/Latinx refers to people of any race who respond to the Census Bureau that they are of Hispanic/Latinx, or Spanish origin.
[8] Note that this analysis considers the median wage for each occupation and then looks at which workers are in these occupations. This correlates closely with, but is not exactly the same as, looking at the median wages for groups of workers.