State of Working Maryland: Poverty in Maryland
Too many Marylanders can’t afford the basics
Maryland is arguably the richest state (per capita) in the nation, yet we struggle to take care of all Marylanders. Furthermore, because we do not provide enough help to struggling families, it can be very hard to escape the cycle of poverty, except through luck.
Poverty describes a person’s ability to afford the basic necessities of life: food, shelter, clothing, transportation. When we say a person is experiencing poverty or is impoverished we mean that person can’t afford the foundations for a healthy life. In 2014, the poverty threshold for a family of three was $19,790 under federal guidelines.[1] One in 10 Marylanders and 1 in 8 children live in poverty, struggling to afford basic necessities like food, shelter, clothing and transportation.[2][3] To put it another way, if the estimated 585,000 Marylanders living in poverty were their own county, it would be the sixth-largest in the state.
The official poverty rate doesn’t take into consideration the services created to prevent poverty. That’s why the Census Bureau created the Supplemental Poverty Measure (SPM), which takes into consideration the supports that help keep families out of poverty. Nutrition assistance, tax credits, and other supports kept 41 million people, including 9 million children, out of poverty nationwide in 2012.[4] Without these transfers and credits, the federal poverty rate would almost double.
Because the federal poverty threshold is the same for the entire country and doesn’t necessarily reflect what it takes to make ends meet in Maryland, the state’s Department of Human Resources has developed an alternative measure of poverty to help guide its efforts to alleviate poverty. Known as the Minimum Living Level (MLL), it is used to determine what families need to get by. Comprised of nine components[5], the MLL represents the minimal standard of living for a family in Maryland. In 2014, the MLL was $1,837 a month for a family of three, or $22,044 for the year.[6] The $2,254 difference between the MLL and the federal poverty threshold illustrates how much harder it is to be poor in Maryland than in many other parts of the country. Marylanders who are struggling to feed their families and pay their bills need additional resources in order to makes ends meet.
Who’s experiencing poverty?
We can know the demographics of poverty from the Census Bureau, but the numbers paint an incomplete picture.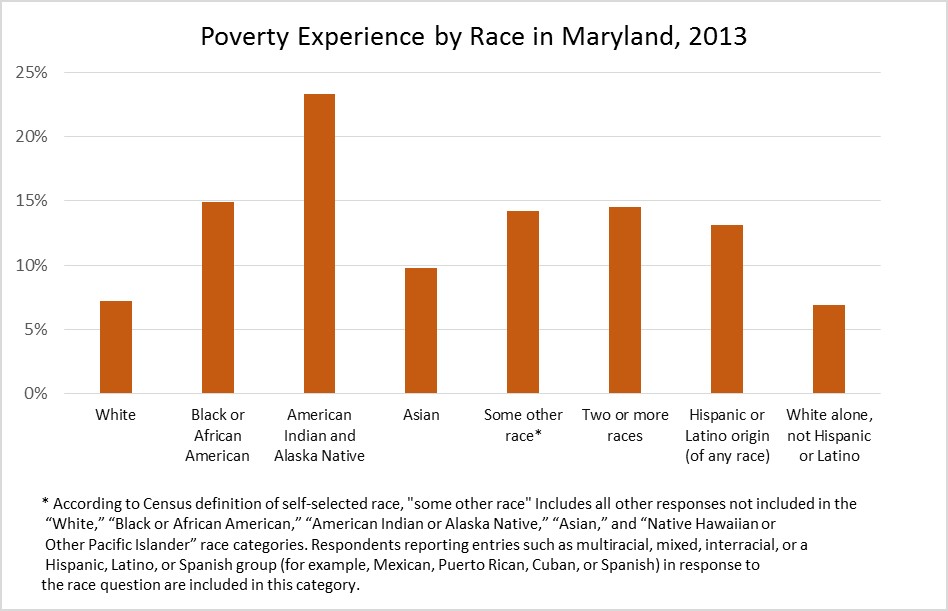
White Marylanders are much less likely to live in poverty than African Americans, Hispanics and other groups. However, the Census cannot tell us why this happens. To get a better understanding of what drives poverty, we need to look at the public policies that have shaped our state and country and how they affect people’s economic well-being.
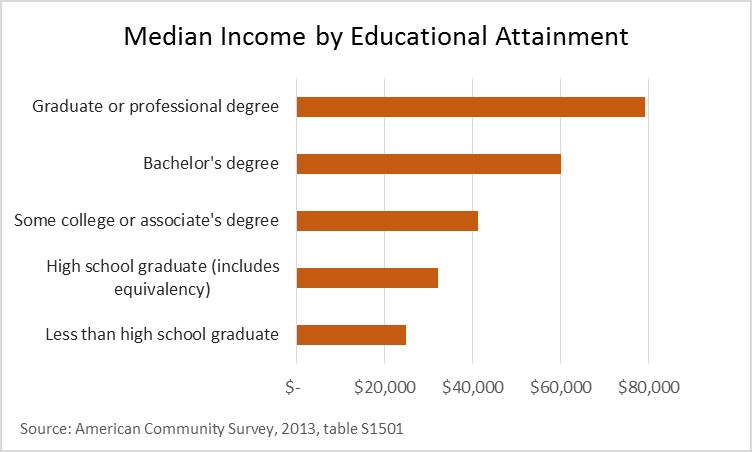
Take education, for instance. We know that the more education a person receives, the less likely he or she is to be poor. Most people living in poverty have only a high school diploma or failed to finish high school. We know that a person’s ability to earn increases with their level of education. Therefore, it is understandable that people with less education would have higher rates of poverty. However, the quality of education varies widely from state to state and from city to city. Baltimore City has higher rates of poverty and a public school system that has struggled to provide its students with an adequate education. While the schools have seen improvement in recent years, the effects of failure in the Baltimore City school system are long-lasting.
Households headed by women are also more likely to experience poverty. In Maryland, women’s median earnings in 2013 were almost $10,000 less than men’s. There is a significant gap in earnings for women who have only a high school diploma or less. This gap persist across racial groups as well, with women always earning less, though white women earn more than other women. The wage gap, as the difference in men and women’s pay has become known, is a national issue. Congress has failed to pass legislation like the Paycheck Fairness Act, which would provide the necessary tools to enforce laws that require equal pay for equivalent jobs.
Location and Poverty
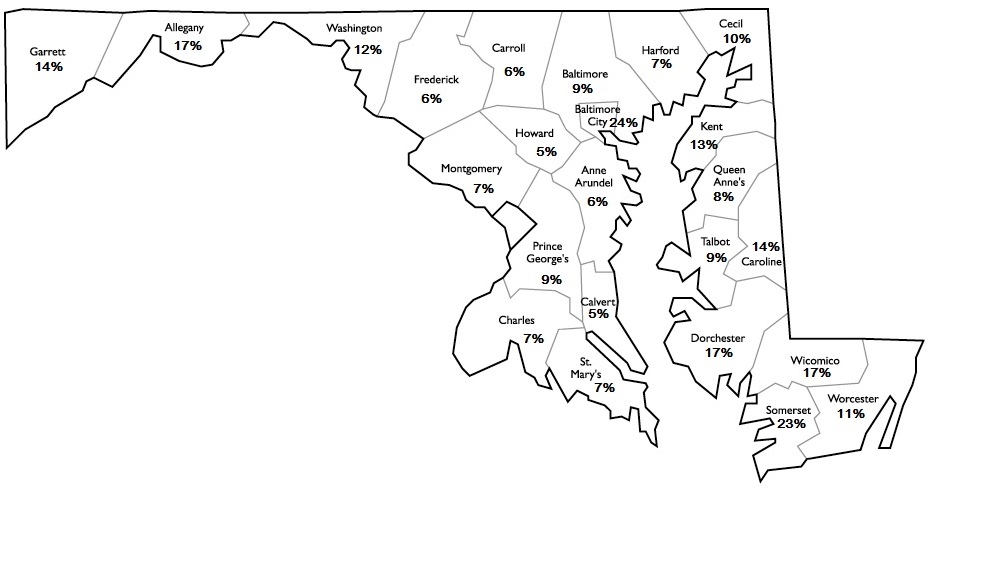
Although once viewed as a blight on big cities, 21st century poverty has expanded and moved to the suburbs. Nationally, suburban poverty increased twice as quickly as poverty in cities between 2000 and 2013. In Maryland, Baltimore City still has the highest percentage of poverty, but western and southern counties are quickly catching up. For example, Somerset County has the highest rural poverty rate at 23 percent. Even so, the greatest number of poor Marylanders are in Montgomery and Prince George’s County.
Policy Implications
Poverty can’t be solved overnight, but by continuing to invest in things that work, like the Earned Income Tax Credit and the Food Supplemental Program — crucial components of our safety net — we can help to catch people who slip into poverty and assist those who are climbing out. On the other hand, cuts to education. healthcare and other investments in Maryland’s prosperity are likely to increase poverty. In the budget proposed for fiscal year 2016, which starts July 1st, education and Medicaid would see massive cuts, leading to job losses for teachers and a dramatic decrease in people’s ability to seek medical care. To help those Marylanders struggling to make ends meet, we need to invest in creating a strong, healthy, and educated workforce.
Today’s blog post is the second in our State of Working Maryland series looking at demographic and economic trends in the state. Previously, this has been an annual publication. This year we will instead publish occasional blogs and research briefs on topics affecting working families in Maryland.
[1]United States Department of Health and Human Services, 2014 Poverty Guidelines, http://aspe.hhs.gov/poverty/14poverty.cfm
[2] U.S Census Bureau, American Community Survey 2013, table DP03
[3] U.S Census Bureau, American Community Survey 2013, table DP03
[4] Wimer, C., Fox, L., Garfinkel, I., Kaushal, N., & Waldfogel, J. (2013) “Trends in Poverty with an Anchored Supplemental Poverty Measure”, http://socialwork.columbia.edu/sites/default/files/file_manager/pdfs/News/Anchored%20SPM.December7.pdf
[5] The 9 components: food, rent, utility, furnishings, clothing/cleaning, personal care, transportation, other family consumption, medical care
[6] Maryland Department of Human Resources, Estimated Living Levels for Temporary Cash Assistance Customers, 2014, http://msa.maryland.gov/megafile/msa/speccol/sc5300/sc5339/000113/019000/019574/unrestricted/20140669e.pdf